Welcome to the AppBlocks Tutorial -- a collection of projects that cover around 90% of the system's functionality. Go through these applications, and you will have a good idea of what can be done with AppBlocks.
37 posts tagged with "tutorial"
View All TagsHere is a cool demonstration of the Scheduler's capabilities: This project takes advantage of the special Sunrise and Sunset features offered by the Scheduler."Sunrise" and "Sunset" refer to the "official" sunrise and sunset times for the specified geographical coordinates. Obviously, these times change throughout the year.
Note
This project can only be tested on a physical ADK, as the Wi-Fi cannot be fully tested on the Cloud Kits, and the cellular Tibbit #45 is not available as well.
Here is another Modbus project. This one polls two BP sensors -- BP#02 and BP#03 -- and prints the data into the debug console. These two sensors provide three data streams, and the application prints all three values at a time.
This project iteration expands on the previous one and adds a dashboard with seven line charts representing the seven data streams the application receives from the two connected Bus Probes (BP Sensors).
This project version modifies the previous one in the following way: Instead of charting the sensor data on the screen, the application records the sensor data in a Log.
In this step, we modify the previous project to publish the sensor data to the MQTT server instead of saving it into the log.
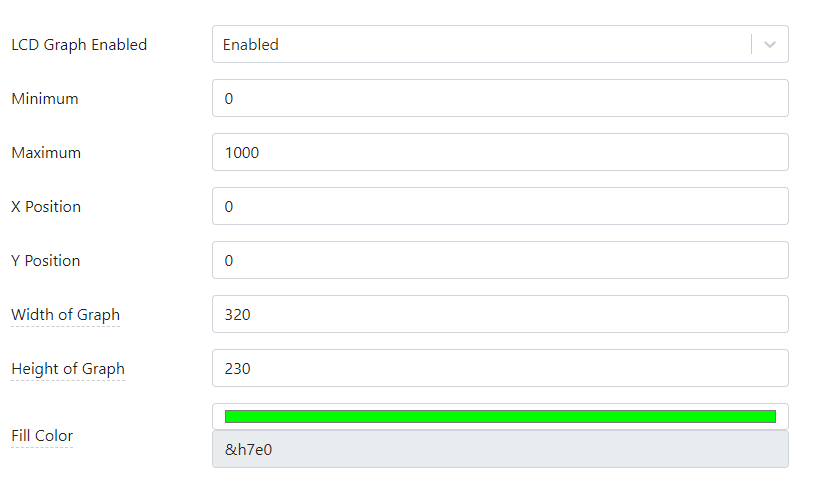
AppBlocks has the facility to draw a chart on the TPS2L's LCD. This is enabled on the LCD Graphing page of the Features Tab. You can select the graph's scale, position on the screen, color, and other parameters:
Note
This project can only be tested on a physical ADK, as the Wi-Fi cannot be fully tested on the Cloud Kits.
Let's consider another popular indoor agriculture system -- the lighting controller. Artificial lighting is a necessary attribute of many indoor growing facilities. Carefully tuned LED panels blast the "sunshine" at just the right wavelengths to promote healthy plant growth while economizing energy consumption.