
41 posts tagged with "tutorial"

View All Tags

BP Sensors to MQTT

In this step, we modify the previous project to publish the sensor data to the MQTT server instead of saving it into the log.

MQTT is a popular protocol for machine-to-machine communications. It is often used to transmit sensor data. This project publishes the seven data streams from four Bus Probe sensors to a test server located at 104.40.239.93.

MQTT is configured on the MQTT page of the Features tab. Here is this application's configuration:

bpsensorstomqtt

Publishing of MQTT data is performed using the MQTT Publish block. This application has four such blocks, one for each data stream. Click on any block to inspect its properties:

bpsensorstomqtt

Testing MQTT

To see the application in action, you will need an MQTT client. We rely on the MQTT Explorer software -- it is free and simple to use. You can download it here:

http://mqtt-explorer.com/

Launch the MQTT Explorer and click + to create a new connection. Fill in the connection parameters as shown below:

bpsensorstomqtt

Click CONNECT. The sensor data will be under demo > devices > bpmqtt:

bp_mqtt_explorer

BP Sensors to LCD Graph

AppBlocks has the facility to draw a chart on the TPS2L's LCD. This is enabled on the LCD Graphing page of the Features Tab. You can select the graph's scale, position on the screen, color, and other parameters:

bpsensortolcdgraph

LCD graphing is only available for projects using the TPP2(G2) platform. This is because only this platform offers the LCD option. Since using this facility requires an LCD, it has to be enabled on the hardware configuration page:

bpsensortolcdgraph

The actual charting is performed using the LCD Graph block. Every time this block is executed, a value of your project's variable selected in the block's properties is shown as the next data point on the graph.

Connecting a Bus Probe (BP) Sensor

Bus Probes (BPs) are a line of RS485 Modbus sensors manufactured by Tibbo Technology. This project shows how to receive the data from the BP#03 sensor, which measures the ambient light. The data from the sensor is then charted on the TPS2L's LCD.

Our AppBlocks Demo Kit (ADK) is equipped with the BP#02 and BP#03 sensors, so the Kit owners will be able to run the application immediately. If you don't have the ADK, here is how you connect a BP sensor to a TPS device.

To communicate with Modbus sensors, your TPS must have an RS485 Tibbit. In this project, we used Tibbit#05. Tibbit #05 not only implements the RS485 port but also breaks out the ground and +5V power lines of the TPS system. Since BP sensors can run on 5V power, this Tibbit is all you need to connect the sensors to your TPS. Here is the wiring diagram for attaching a BP sensor to the TPS. All sensors in the BP lineup have identical wiring requirements:

ac_not_found

Modbus Configuration in the Application

To work with BP sensors and most other Modbus devices, an application must be configured as a Modbus master. This is done on the Modbus Master page of the Features Tab:

bpsensortolcdgraph

As you can see, the Device ID of the sensor is 66. This is an arbitrary choice -- the ID may be different, but the BP sensor must be assigned a matching ID for the system to work. To configure your BP sensor, use the WebBP web app from Tibbo. You will need a Web485 Board and a Chrome (or Chromium-based) browser to use the app. BP sensors installed on the AppBlocks Demo Kit come pre-configured with IDs matching those expected by the Tutorial applications.

In addition to the ID configuration, you must add all Modbus registers you want your TPS to poll. BP03 has a single register of interest:

bpsensortolcdgraph

Once you add a Modbus register, a linked variable is auto-generated. This is similar to the automatic creation of variables for (one-shot) timers, settings, and IO lines:

bpsensortolcdgraph

Modbus Polling

AppBlocks handles all Modbus polling in the background. All your application has to do is read the linked variable's value. Click on the LCD Graph block on the canvas to see that it contains a single property for selecting a variable, the light variable in this case. This is the auto-generated variable linked to the BP sensor's register.

bpsensortolcdgraph

Run this application to see the graph appear on the TPS LCD.

You can connect a wide variety of Modbus devices to your TPS, so the choice is not limited to Modbus products offered by Tibbo alone. AppBlocks also supports Modbus TCP, allowing you to work with "networked" Modbus slaves. Your TPS itself can serve as a Modbus slave device. This is configured on the Modbus Slave page of the Features tab.

Wi-Fi Switchover

Now let us modify the BP Sensors to MQTT project to explore a different subject -- the use of network interfaces other than Ethernet.

Ethernet is not the only network interface TPS devices have. If your TPS is equipped with the WA2000 Wi-Fi/BLE add-on, you can also enable Wi-Fi communications:

wifiswitchover

Wi-Fi is configured on the Wi-Fi page of the Features Tab:

wifiswitchover

In this project, three Wi-Fi properties -- SSID, Security Type, and Password are linked to properties. You can edit these properties in the LUIS app.

AppBlocks treats Wi-Fi as a secondary interface that will only be used if Ethernet -- the system's preferred interface -- becomes unavailable. Therefore, you will need to unplug the Ethernet cable to see the application switch to the Wi-Fi interface. As soon as the cable is plugged back in, the application will resume using the Ethernet interface.

To prepare for the potential switchover, the application associates with the access point and attempts to maintain the association at all times. This way, the Wi-Fi is ready to roll as soon as the Ethernet connection fails.

AppBlocks defines the "Ethernet down" condition as the failure of the Ethernet link. This is when the yellow link LED of your TPS turns off. This happens if you unplug the Ethernet cable or power down the network switch your TPS is connected to. AppBlocks is not yet able to detect other problems with your LAN.

Unplugging the Ethernet cable while running in Debug mode poses a problem: All console messages are sent via the Ethernet interface. If any messages are sent to the debug console, the application will get stuck at the first such message -- the system will wait for the message to get through, and this won't happen until you plug the Ethernet cable back in.

This project switches the Logging output to LCD_logging to avoid this situation. This is selected on the General page of the Features tab:

wifiswitchover

Testing Wi-Fi Switchover

Now you are all set to test the WI-Fi switchover:

  • Run the application in debug mode
  • Configure your Wi-Fi connection using the LUIS app
  • Make sure the MQTT server is receiving the sensor data published by your TPS
  • Unplug the Ethernet cable -- messages on the LCD will tell you that your TPS is now using the Wi-Fi interface
  • Plug the Ethernet cable back in -- the system will switch to using the Ethernet connection

Wi-Fi LED Patterns

Your TPS has five blue LEDs. When the Wi-Fi interface is active, these LEDs show the status of your Wi-Fi connection.

When the TPS' Wi-Fi interface is trying to associate with an access point, blue LEDs show this "running" pattern:

Wi-Fi signals -- associating

When the Wi-Fi interface is associated with an access point, the five blue LEDs display the signal strength. The stronger the signal, the taller the LED bar will be. For example, here is the pattern for the "four out of five" signal strength:

wifi signals -- associated

PWM Light Control - Ver. 1

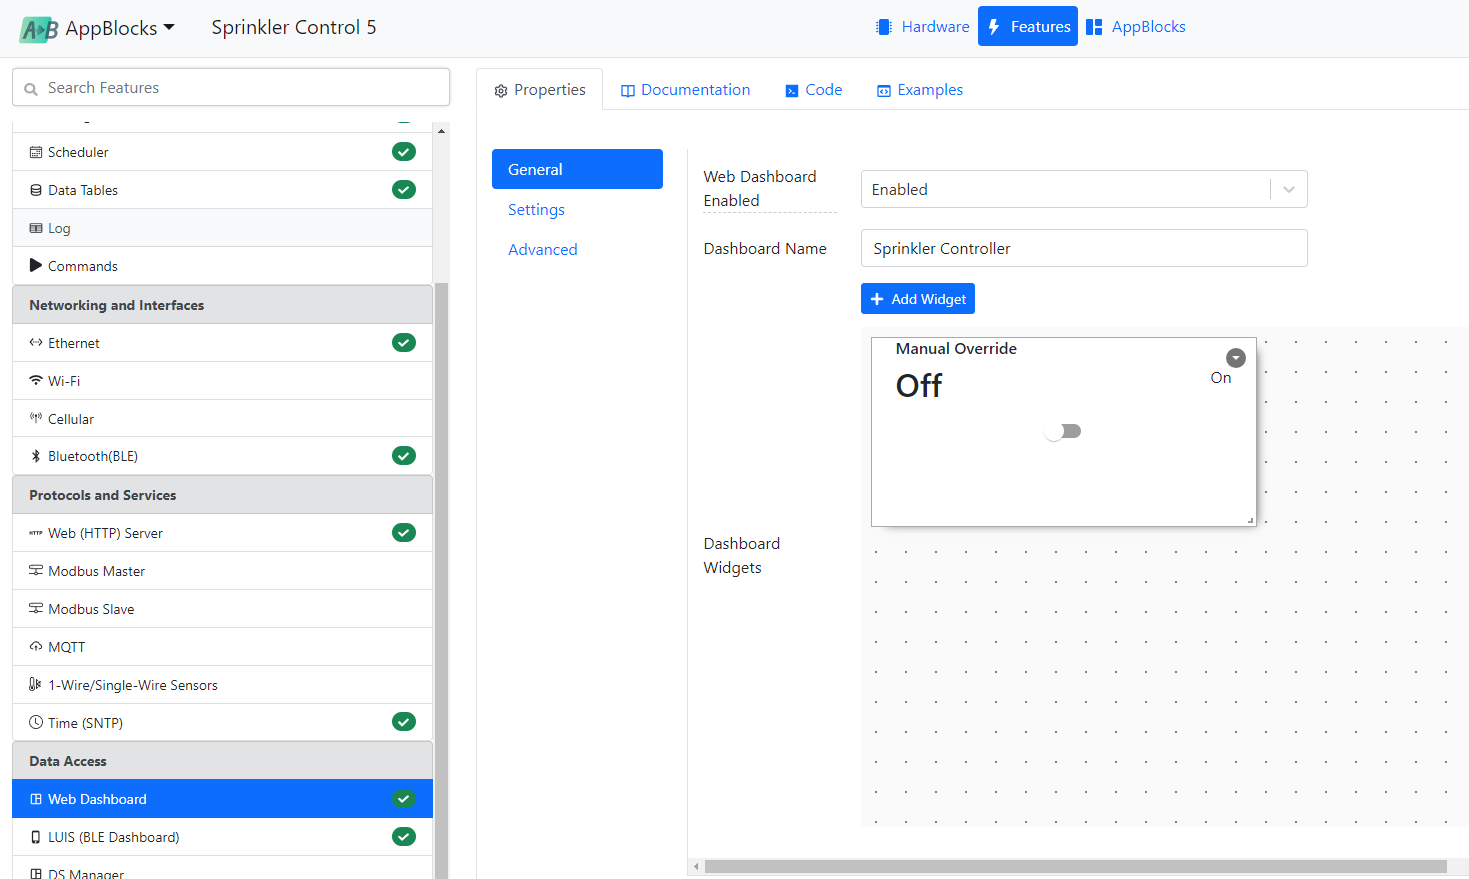
Let's consider another popular indoor agriculture system -- the lighting controller. Artificial lighting is a necessary attribute of many indoor growing facilities. Carefully tuned LED panels blast the "sunshine" at just the right wavelengths to promote healthy plant growth while economizing energy consumption.

Since the plants expect to "see" proper sunrise and sunset cycles, you can't just "flip a switch" and suddenly dose them with the full power of your LED lights. It is best to emulate the gradual sunrise, as it happens in the natural world. Similarly, you can't just "turn the sun off" in the "evening" -- there must be a proper "sunset," or your plants will get confused.

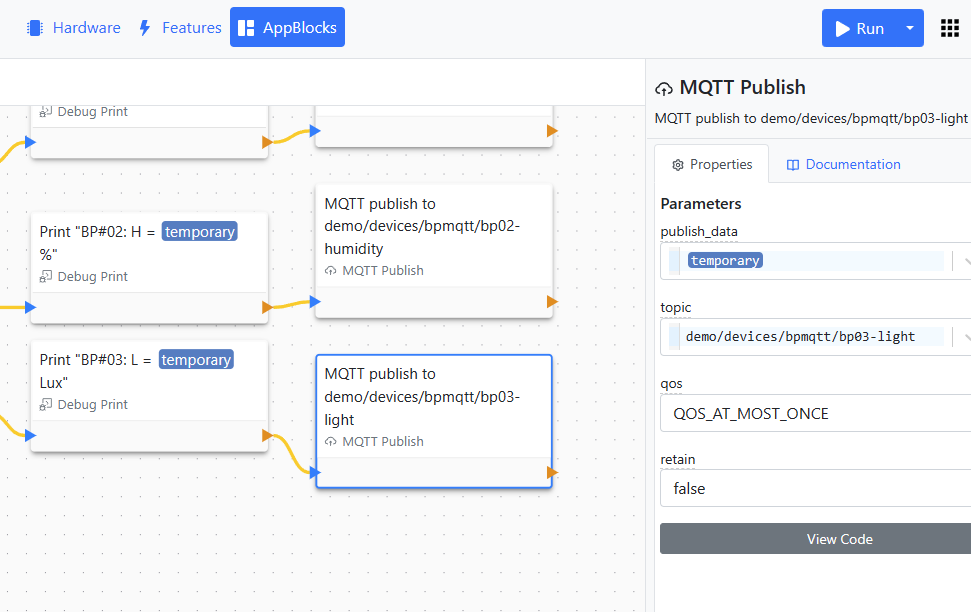
LED dimming is typically controlled through pulse-width modulation (PWM). Tibbo offers two PWM Tibbits -- #16 and #17; this project uses #16. The project also prints the PWM output levels to the console, so you can run it even if you are not using the AppBlocks Demo Kit (ADK) and do not have this Tibbit.

On the ADK, channel 1 of Tibbit #16 is connected to a red status LED marked "PWM1." The brightness of this LED depends on the duty cycle of the signal coming out of the PWM Tibbit.

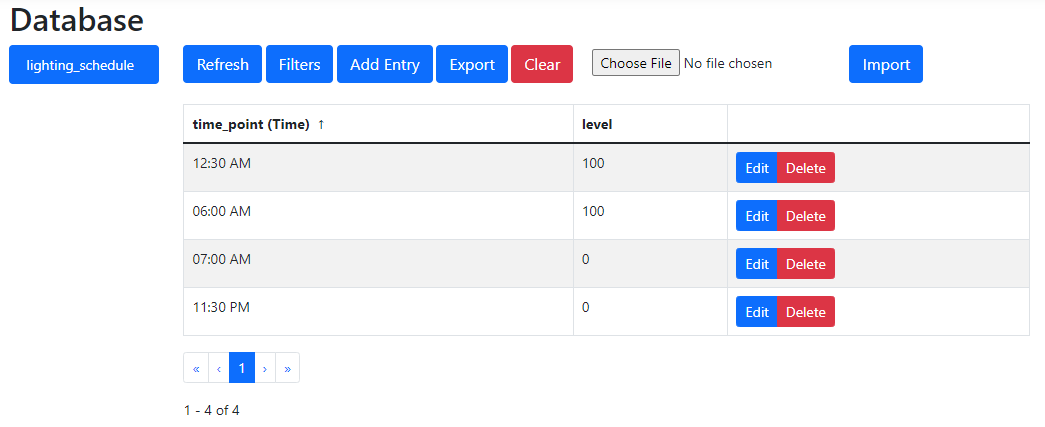
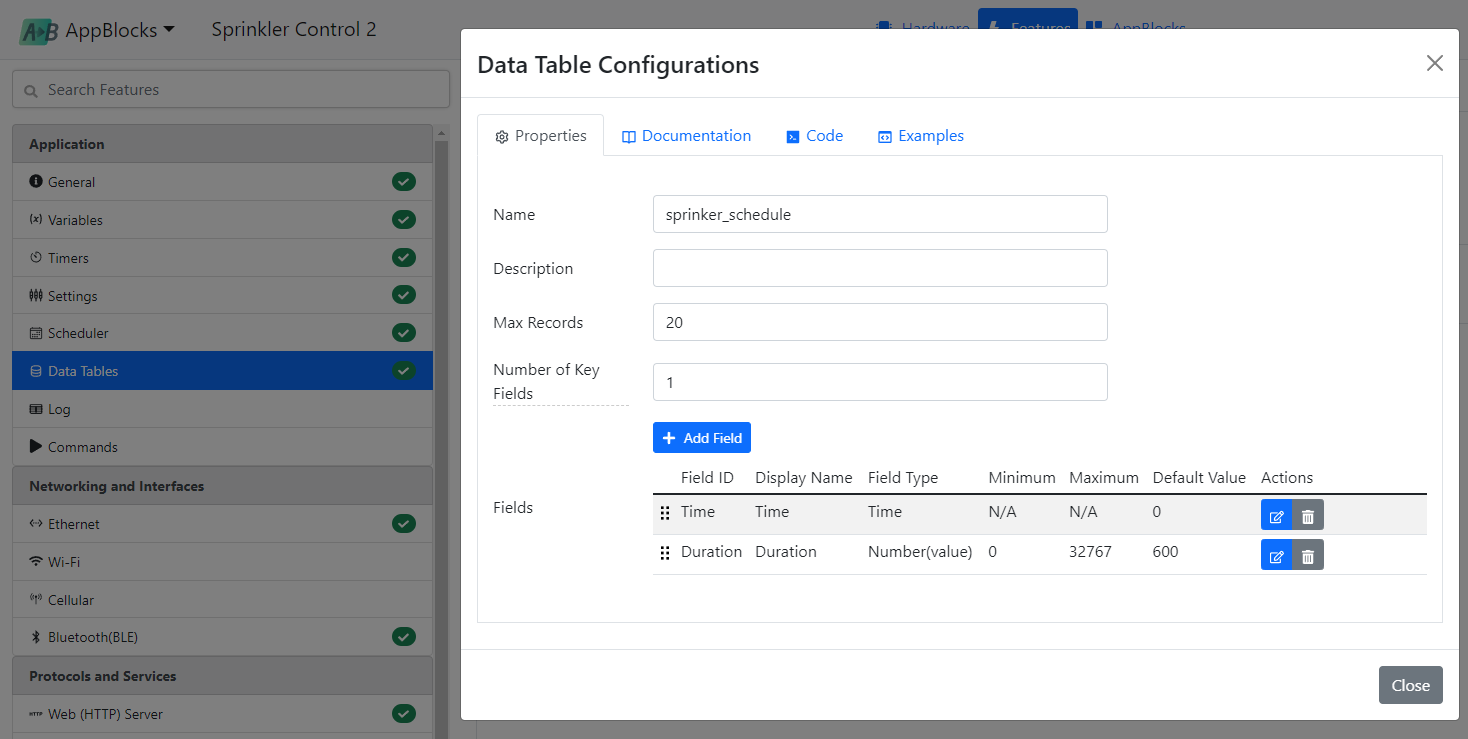
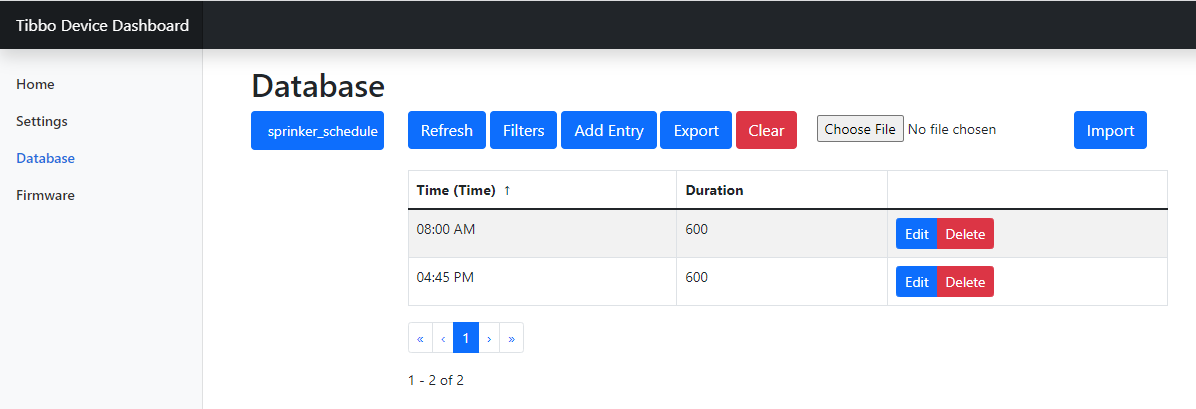
At the heart of the application is the data table called lighting_schedule. This table has two fields: time_point and level. Users define the key points in the current schedule, and the system gradually changes the light levels (interpolates) between these points. Let's illustrate this with an example.

Suppose you have the following schedule:

time_pointlevel
11:30 PM0
00:30 AM100
06:00 AM100
07:00 AM0

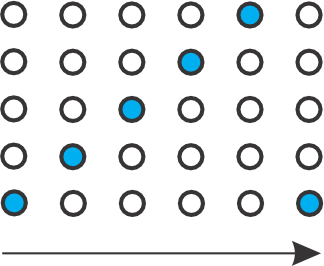
So, the "sunrise" is at 11:30 PM (not unusual for growrooms. as the electricity is cheaper at night). The sun is "fully up" by 30 minutes past midnight. The "sun" starts to "go down" at 06:00 AM, and by 07:00, it is dark. This cycle is illustrated by the following diagram:

pwm_light_rollover

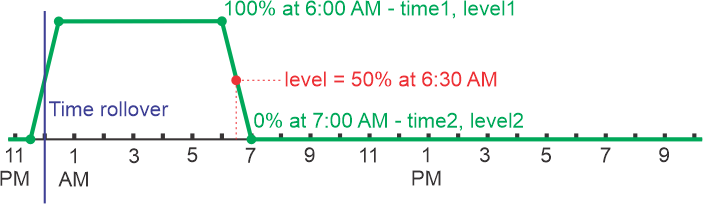
The job of the application is to interpolate the light levels between the time points. For example, knowing that the LED brightness is 100% at 6 AM and 0% at 7 AM, the system should be able to determine, that the brightness at 6:30 AM equals 50%.

The simplified formula for calculating the "spot brightness" is as follows:

pwm_light_rollover

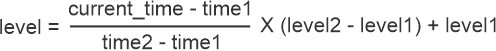
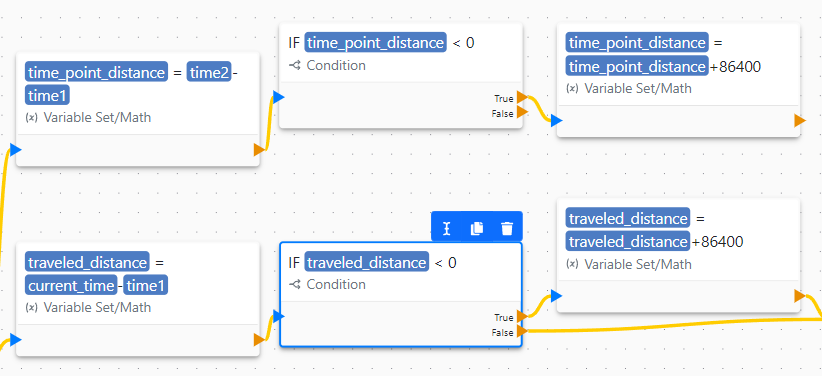
This simplified formula disregards the cyclical nature of the time-of-day value: The time "rolls over" between the first and the second records of the above data table. Meaning the time value of the second record is smaller than the time value of the first record, and this possibility is taken into account by the application. This is done in the following section of the flowchart:

pwm_light_rollover

In AppBlocks, all times are presented as the serialized number of seconds. For example, the time value for 2 AM is 2 60 60 = 7200. The value of 86400 is the total number of seconds in the day.

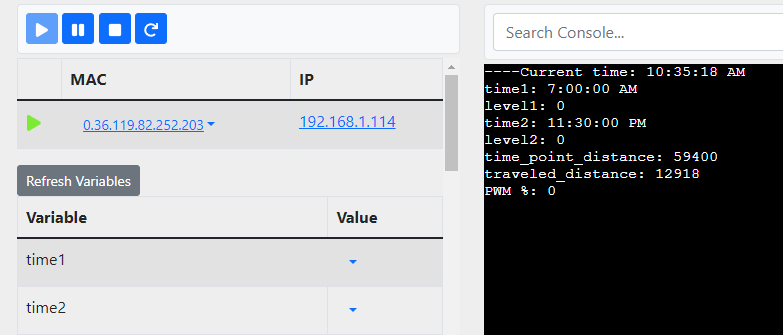
Now we are going to explain how the calculations are made. For illustration, let's assume that the current time is 06:30 AM.

At 5-second intervals, the application does the following:

  • The current date and time are obtained and saved into the time_how variable (in this example, the present time is 06:30 AM).
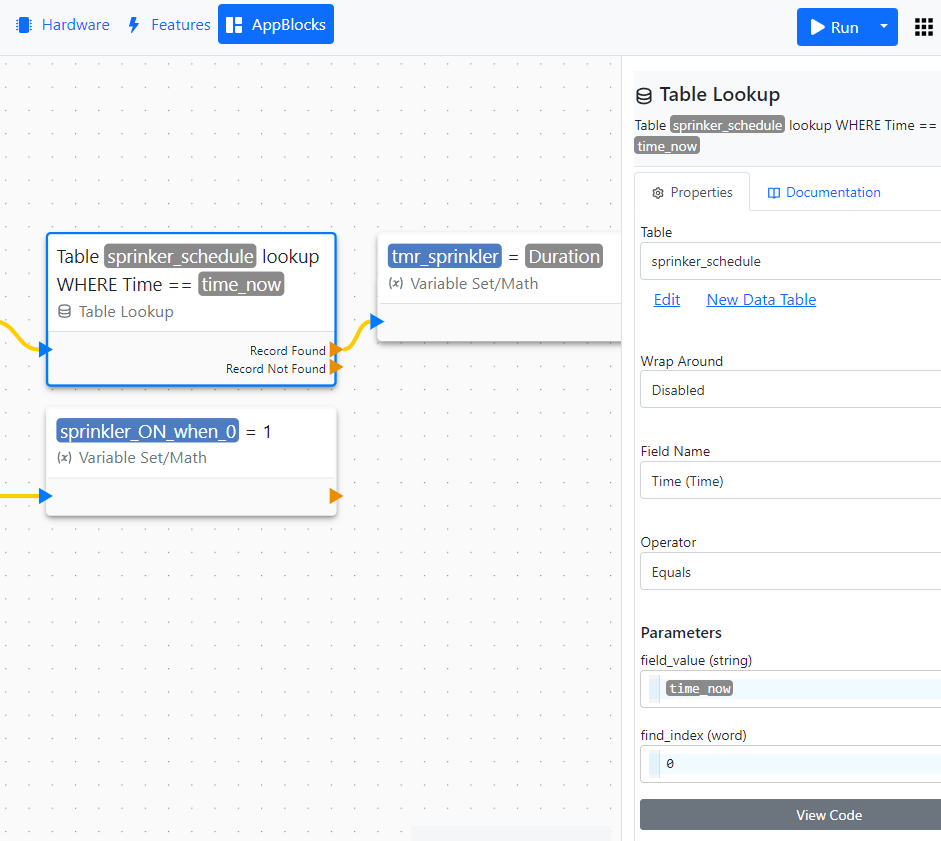
  • The first Table Lookup finds a record with a time point that is less or equal to the current time. This would be the third record. The time_point and the level values from this record are saved into the time1 and level1 variables.
  • The second Table Lookup finds a record with a time point greater than the current time. This would be the fourth record. The time_point and the level values from this record are saved into the time2 and level2 variables.
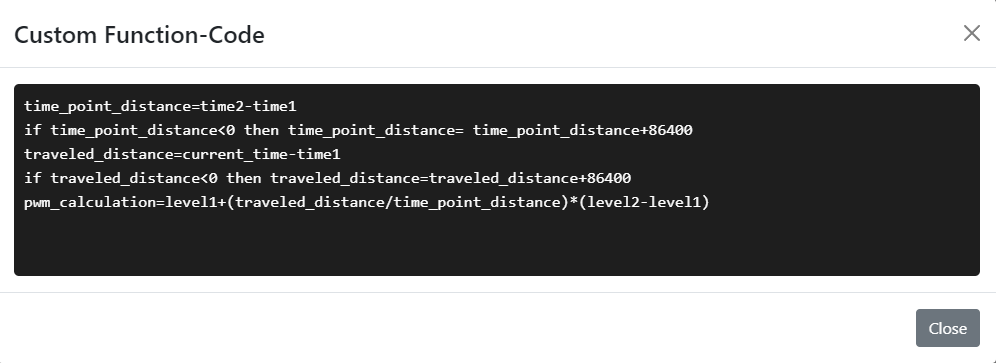
  • The time_point_distance variable is then set to the distance, in seconds, between time1 and time2. This is done with the "time rollover" check and, if needed, the value correction.
  • The traveled_distance variable is then set to the distance between time1 and the current_time. Once more, this is done with the "time rollover" check and, if needed, the value correction.
  • Finally, the PWM level is calculated.

When searching within the lighting_schedule table, the system knows that the records must first be sorted in ascending order of times. The above example will work even if your data table has a different (and random) order of times. The time-ordered list of records for the above example is as follows:

time_pointlevel
00:30 AM100
06:00 AM100
07:00 AM0
11:30 PM0

After the internal sorting of the records, the system will conduct the search in the correct direction. For the first Table Lookup block, which searches for the record with a time less or equal to the given time, the system will search in the descending order of time_point values. For the second Table Lookup block, which searches for the record with a time greater than the given time, the system will search in the ascending order of time_point values.

Further, for the first time in this Tutorial, the Wrap Around parameter of the Table Lookup block is set to Enabled for both lookup blocks. This is because the next or previous record the system is looking for might be on the other end of the table! For example, when the current time is 00:15 AM, and the first Table Lookup block needs to locate the record with the time that is less or equal to the present time, the target record is the "11:30 PM" record! The search will need to "wrap around" to find this record.

Well folks, there you have it, a complete PWM control solution for your growroom, implemented in just 25 blocks. Of this block count, 8 are Debug Print blocks and can be dropped, meaning that the entire application only took 17 blocks to build! The next topic shows how this count could be reduced even further.

pwm_light_tablepwm_light_console

PWM Light Control - Ver. 2

Here is another version of the PWM Light Control Project. It does exactly the same thing as the one in the previous effort. The difference is in the use of the Custom Function block. The block may contain multiple lines of formulas and other code.

To view the code, click the Custom Function block to open its properties. To do this with more comfort, click the Expand icon:

pwm_light_icon

Here is the code:

pwm_light_function_code

The code inside the Custom Function block must be written in Tibbo BASIC. What you are editing here is the body of a Tibbo BASIC function. You are even supposed to give this function a name.

Since Tibbo BASIC is very similar to other versions of the BASIC language, and since most Tibbo BASIC math formulas look completely "natural," it will be easy for you to learn how to pack complex calculations into custom functions. Here is what the output Tibbo BASIC code looks like:

function pwm_calculation() as float
time_point_distance=time2-time1
if time_point_distance<0 then time_point_distance= time_point_distance+86400
traveled_distance=current_time-time1
if traveled_distance<0 then traveled_distance=traveled_distance+86400
pwm_calculation=level1+(traveled_distance/time_point_distance)*(level2-level1)
end function

In the above "printout," only the first and last lines are auto-generated. The user is responsible for all the code inside the function. The name of the function is explicitly defined by the user, and the function type is determined automatically from the type of the variable the result is assigned to. For example, in this project, the assignment is x=pwm_calculation(), where x is a number (float). Based on this, the system determines that the function shall also return a number (float).

The Custom Function block allows you to further reduce the total number of blocks in the project. Compared to the previous version, which required 25 blocks (17 if you excluded Debug Print blocks), this new incarnation only takes 12 blocks (11 if we disregard printing). Small flow diagrams often look better than large ones!

To be fair, the block count reduction in this project wasn't achieved solely through Custom Functions. Another decluttering step was to print all items within a single Debug Print block. Check out the block contents to see how this was done.

Sprinkler Control 1: Hardcoded Schedule

Having worked through The Basics section of the Tutorial, you now know enough to take on a "real project." We start with a multi-step implementation of a device that is common in agriculture -- the Sprinkler (Watering) Controller. Such controllers turn the plant watering on and off according to a pre-defined schedule.

You already saw two simple applications of the Scheduler: The Scheduler project triggers the time printing every minute on the minute, while the Scheduler (Sunrise and Sunset) application synchronizes the street lights to the sunrises and sunsets. We open this chapter with a more generic example of Scheduler usage.

Let's say you want to automatically water your plants twice daily at 8 am and 4:45 pm. Each cycle should continue for five minutes.

Here is a sprinkler control application that hardcodes this logic. As you can see, the implementation comprises two schedules of the "every day at hh : mm" type and a timer.

Monitoring the Sprinkler Relay State

The same relay used in the Sunrise and Sunset project controls the sprinkler in this one. On the AppBlocks Demo Kit (ADK), this relay is connected to a green LED marked "RL1." The LED is on when the relay is on.

sprinkler_scheduler

Sprinkler Control 2: Data Table Schedule

Hardcoding the watering start times and duration -- as we did in the first version of the application -- is a "quick and dirty" way of creating a Sprinkler Controller for personal use. If you are designing for your customers, a bit more "finesse" will be required to satisfy the general public. Obviously, the proper way is to have an editable schedule table. Each entry in this table would consist of the watering start time and the watering duration.

This is where the data tables come in. These are defined on the Data Tables page of the Features tab. Here is the structure of this project's sprinkler_schedule table:

sprinkler_table_config

As soon as a single data table is defined in your application, the Web Dashboard is enabled automatically. This differs from the settings, which must be exposed to the web or LUIS interface individually.

sprinkler_control_2

The corresponding AppBlocks block is called Table Lookup. It is the centerpiece of this application. Here is how the application works:

A Scheduler triggers the execution every minute, on the minute. The application then fetches the current date and time. The Table Lookup block compares the present time with the Time field of all table records. If there is a match, the sprinkler relay is activated, and the tmr_sprinkler timer is loaded with the value from the Duration field of the fetched data table record (the record that matched the current time).

sprinkler_lookup

The Get Current DateTime block fetches the current date and time. The Table Lookup block compares this with the Time field of the data table records. This works because the system understands that the Date component must be disregarded in the DateTime-to-Time comparison.

Notice the two cases of parameter passing in this application. The first instance is passing the current date and time from the Get Current DateTime block to the Table Lookup block. The latter receives the date and time in the time_now parameter. The second instance is passing the watering duration from the Table Lookup block to the Variable Set/Math block. The latter receives the watering duration (from the fetched field) as the Duration parameter.

This, and many other projects, takes advantage of the LUIS interface. The application makes two settings -- Ethernet DHCP and Ethernet IP -- accessible from the LUIS smartphone app.

Sprinkler Control 3: Status on LCD

This project expands on the previous application by adding status messages displayed on the LCD. For this to work, you must have the TPS2L(G2) device -- only this model has the LCD (and keypad).

LCD messages are printed using the LCD Print block. The application prints two messages: "WATERING (SPRINKLERS ON)" and "IDLE". Click on either block to see the list of available properties:

sprinkler_lcd_print

LCD messages are printed within the bounds of a rectangle formed by the X Position, Y Position, Width, and Height parameters. The Text Alignment property defines the text alignment within this rectangle, while Text Orientation allows you to print the text normally, upside down, or vertically.

sprinkler_lcd_print

For example, to print the "IDLE" message in the middle of the screen, use X Position = 0, Y Position = 0, Width = 320, Height = 240, and Text Alignment = Middle Center.

The numbers 320 and 240 come from the TPS screen resolution, which is 320 x 240 pixels.

Sprinkler Control 4: Manual Watering

It is great to have the watering happen on schedule, but sometimes you will want to manually operate the sprinklers, even if to test that the hardware works properly.

This Sprinkler Control project step adds a manual override: The TPS2L(G2) has a four-key keycap. The application displays "ON" over the first key (F2) and "OFF" over the fourth key (F4). Pressing the "ON" key turns the relay on, and the "WATERING (MANUAL)" message is shown on the screen. Pressing the "OFF" key turns the relay off.

The response to key presses is implemented through the On Keypad Pressed event block (the corresponding key is selected in the block's properties).

There is also the On Keypad Released event block.

Explore how this application implements overrides. This is done correctly: Once you have enabled the sprinklers manually, the end of scheduled watering will not turn the relay off. This logic is implemented through the manual_override variable.

Sprinkler Control 5: Web Dashboard

In this next iteration of the Sprinkler Control project, the ability to monitor the state of and control the sprinkler relay remotely is added. This is done through the dashboard, a page of your device's web interface that can host widgets. The dashboard is configured on the General subpage of the Web Dashboard page of the Features tab. Open this page to see the widget this project uses:

sprinkler_widgets

The widget is of the Switch type. The switch is "connected" to the manual_override variable:

sprinkler_dashboard_variable

This "connection" is bi-directional:

  • If you push the "ON" or "OFF" button on the TPS, the dashboard switch will reflect the current manual_override state.
  • If you flip the switch on the dashboard, the manual_override variable will be updated.
sprinkler_control_5

To react to the dashboard switch flips, an On Variable Changed event block has been added to the application. This event triggers when the corresponding variable value changes.

The On Variable Changed block was first introduced in the Settings project.

This, and many other projects, takes advantage of the LUIS interface. The application makes two settings -- Ethernet DHCP and Ethernet IP -- accessible from the LUIS smartphone app.