
6 posts tagged with "modbus"

View All Tags

4G (Cellular) Switchover

In the previous topic, we explored the Wi-Fi interface and how your device can be configured to automatically switch over to Wi-Fi if the Ethernet link is unavailable. In addition to Ethernet and Wi-Fi, TPS devices support 4G communications. This project uses the LTE Tibbit (#45) as a backup way to send data to the MQTT server when the Ethernet connection goes down.

4gswitchover

Note: The AppBlocks Demo Kit (ADK) does not contain Tibbit #45. You'll need to obtain this Tibbit separately if you wish to test this project.

4G is enabled on the Cellular page of the Features tab:

4gswitchover

As with Wi-Fi, AppBlocks treats cellular as an alternative interface that will only be used if Ethernet -- the system's preferred interface -- becomes unavailable. Therefore, you must unplug the Ethernet cable to see the application switch to the 4G connection. As soon as the cable is plugged back in, the application will resume using the Ethernet interface.

Unlike with Wi-Fi, the system does not enable the 4G connection until it is actually needed. This is because sending and receiving data over 4G costs money, and there is always some traffic over 4G links, even when your system is not sending anything meaningful. To avoid wasting your funds, 4G only gets going after the Ethernet link fails and is shut down as soon as the Ethernet link is restored.

This project runs with Wi-Fi disabled, but you can enable it by yourself to see the switchover between all three interfaces:

  • The Ethernet is the preferred interface. The Wi-Fi interface will be unused (but associated with the access point) whenever there is an Ethernet link. 4G will be disabled.
  • If the Ethernet link goes down, the application will attempt to use Wi-Fi.
  • If it is impossible to associate with an access point, 4G communications will be attempted.

4G LED Patterns

As with Wi-Fi, TPS uses the five blue LEDs to tell you about the status of your 4G connection.

When the 4G interface is in the process of linking up to the cellular network, the following dynamic pattern plays on the LEDs:

4G signals -- connecting

When the link is established, you will see this static pattern:

4G signals -- connected

BP Sensors to Console

Here is another Modbus project. This one polls two BP sensors -- BP#02 and BP#03 -- and prints the data into the debug console. These two sensors provide three data streams, and the application prints all three values at a time.

Our AppBlocks Demo Kit (ADK) is equipped with the BP#02 and BP#03 sensors, so the Kit owners will be able to run the application immediately.

As with the previous project, the IDs and registers of the BP sensors are configured on the Modbus Master page of the Features Tab. For example, here is the configuration for the temperature and humidity sensor (BP#02):

bpsensorstoconsole_sensorThe data coming from BP#02 is not expressed in degrees Celsius or humidity percentages, so a conversion to standard measurement units is nevessary. This conversion is performed by the row of **Variable Set/Math** blocks. BP#03, our ambient light sensor, requires no data massaging.

Here is what the application's output looks like:

bp_console

BP Sensors to Log

This project version modifies the previous one in the following way: Instead of charting the sensor data on the screen, the application records the sensor data in a Log.

Logs are special data tables that can only be appended to. There may only be one log table per device. Log table structure needs not to be defined in advance -- your application may add log columns on the fly. There is no way for the application to clear the log. This can only be done by the user through the web interface.

Logging is enabled on the Log page of the Features tab. Records are added using the Add to Log block. Click on this block in the current application to examine its properties:

bpsensorstolog

As you can see, log records consist of key-value pairs. The key is the name of the field (column) the data will go into. The value is the data itself. Log fields are stored in the string format, so there is no division into data types here.

If an invocation of the Add to Log block defines a key (column) that doesn't yet exist, this column is added before appending a new record. Add to Log blocks do not have to fill out every existing field -- supplying partial data leaves the remaining fields blank.

Calling the Add to Log block with key1-value and then calling this block again with key2-value is different than calling the block once with both key1 and key2 present. The first sequence will result in adding two records. Both records will have one of the fields filled in and one of the fields empty. Only one record will be added in the second case, and it will have data in both fields.

This application supplies all the key-value pairs every time. Here is how the log looks in the web interface:

bpsensorstolog

BP Sensors to MQTT

In this step, we modify the previous project to publish the sensor data to the MQTT server instead of saving it into the log.

MQTT is a popular protocol for machine-to-machine communications. It is often used to transmit sensor data. This project publishes the seven data streams from four Bus Probe sensors to a test server located at 104.40.239.93.

MQTT is configured on the MQTT page of the Features tab. Here is this application's configuration:

bpsensorstomqtt

Publishing of MQTT data is performed using the MQTT Publish block. This application has four such blocks, one for each data stream. Click on any block to inspect its properties:

bpsensorstomqtt

Testing MQTT

To see the application in action, you will need an MQTT client. We rely on the MQTT Explorer software -- it is free and simple to use. You can download it here:

http://mqtt-explorer.com/

Launch the MQTT Explorer and click + to create a new connection. Fill in the connection parameters as shown below:

bpsensorstomqtt

Click CONNECT. The sensor data will be under demo > devices > bpmqtt:

bp_mqtt_explorer

BP Sensors to LCD Graph

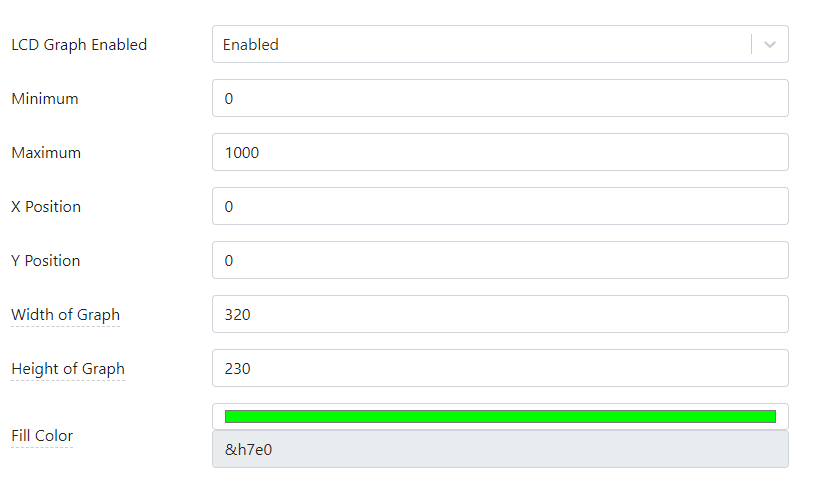
AppBlocks has the facility to draw a chart on the TPS2L's LCD. This is enabled on the LCD Graphing page of the Features Tab. You can select the graph's scale, position on the screen, color, and other parameters:

bpsensortolcdgraph

LCD graphing is only available for projects using the TPP2(G2) platform. This is because only this platform offers the LCD option. Since using this facility requires an LCD, it has to be enabled on the hardware configuration page:

bpsensortolcdgraph

The actual charting is performed using the LCD Graph block. Every time this block is executed, a value of your project's variable selected in the block's properties is shown as the next data point on the graph.

Connecting a Bus Probe (BP) Sensor

Bus Probes (BPs) are a line of RS485 Modbus sensors manufactured by Tibbo Technology. This project shows how to receive the data from the BP#03 sensor, which measures the ambient light. The data from the sensor is then charted on the TPS2L's LCD.

Our AppBlocks Demo Kit (ADK) is equipped with the BP#02 and BP#03 sensors, so the Kit owners will be able to run the application immediately. If you don't have the ADK, here is how you connect a BP sensor to a TPS device.

To communicate with Modbus sensors, your TPS must have an RS485 Tibbit. In this project, we used Tibbit#05. Tibbit #05 not only implements the RS485 port but also breaks out the ground and +5V power lines of the TPS system. Since BP sensors can run on 5V power, this Tibbit is all you need to connect the sensors to your TPS. Here is the wiring diagram for attaching a BP sensor to the TPS. All sensors in the BP lineup have identical wiring requirements:

ac_not_found

Modbus Configuration in the Application

To work with BP sensors and most other Modbus devices, an application must be configured as a Modbus master. This is done on the Modbus Master page of the Features Tab:

bpsensortolcdgraph

As you can see, the Device ID of the sensor is 66. This is an arbitrary choice -- the ID may be different, but the BP sensor must be assigned a matching ID for the system to work. To configure your BP sensor, use the WebBP web app from Tibbo. You will need a Web485 Board and a Chrome (or Chromium-based) browser to use the app. BP sensors installed on the AppBlocks Demo Kit come pre-configured with IDs matching those expected by the Tutorial applications.

In addition to the ID configuration, you must add all Modbus registers you want your TPS to poll. BP03 has a single register of interest:

bpsensortolcdgraph

Once you add a Modbus register, a linked variable is auto-generated. This is similar to the automatic creation of variables for (one-shot) timers, settings, and IO lines:

bpsensortolcdgraph

Modbus Polling

AppBlocks handles all Modbus polling in the background. All your application has to do is read the linked variable's value. Click on the LCD Graph block on the canvas to see that it contains a single property for selecting a variable, the light variable in this case. This is the auto-generated variable linked to the BP sensor's register.

bpsensortolcdgraph

Run this application to see the graph appear on the TPS LCD.

You can connect a wide variety of Modbus devices to your TPS, so the choice is not limited to Modbus products offered by Tibbo alone. AppBlocks also supports Modbus TCP, allowing you to work with "networked" Modbus slaves. Your TPS itself can serve as a Modbus slave device. This is configured on the Modbus Slave page of the Features tab.

Wi-Fi Switchover

Now let us modify the BP Sensors to MQTT project to explore a different subject -- the use of network interfaces other than Ethernet.

Ethernet is not the only network interface TPS devices have. If your TPS is equipped with the WA2000 Wi-Fi/BLE add-on, you can also enable Wi-Fi communications:

wifiswitchover

Wi-Fi is configured on the Wi-Fi page of the Features Tab:

wifiswitchover

In this project, three Wi-Fi properties -- SSID, Security Type, and Password are linked to properties. You can edit these properties in the LUIS app.

AppBlocks treats Wi-Fi as a secondary interface that will only be used if Ethernet -- the system's preferred interface -- becomes unavailable. Therefore, you will need to unplug the Ethernet cable to see the application switch to the Wi-Fi interface. As soon as the cable is plugged back in, the application will resume using the Ethernet interface.

To prepare for the potential switchover, the application associates with the access point and attempts to maintain the association at all times. This way, the Wi-Fi is ready to roll as soon as the Ethernet connection fails.

AppBlocks defines the "Ethernet down" condition as the failure of the Ethernet link. This is when the yellow link LED of your TPS turns off. This happens if you unplug the Ethernet cable or power down the network switch your TPS is connected to. AppBlocks is not yet able to detect other problems with your LAN.

Unplugging the Ethernet cable while running in Debug mode poses a problem: All console messages are sent via the Ethernet interface. If any messages are sent to the debug console, the application will get stuck at the first such message -- the system will wait for the message to get through, and this won't happen until you plug the Ethernet cable back in.

This project switches the Logging output to LCD_logging to avoid this situation. This is selected on the General page of the Features tab:

wifiswitchover

Testing Wi-Fi Switchover

Now you are all set to test the WI-Fi switchover:

  • Run the application in debug mode
  • Configure your Wi-Fi connection using the LUIS app
  • Make sure the MQTT server is receiving the sensor data published by your TPS
  • Unplug the Ethernet cable -- messages on the LCD will tell you that your TPS is now using the Wi-Fi interface
  • Plug the Ethernet cable back in -- the system will switch to using the Ethernet connection

Wi-Fi LED Patterns

Your TPS has five blue LEDs. When the Wi-Fi interface is active, these LEDs show the status of your Wi-Fi connection.

When the TPS' Wi-Fi interface is trying to associate with an access point, blue LEDs show this "running" pattern:

Wi-Fi signals -- associating

When the Wi-Fi interface is associated with an access point, the five blue LEDs display the signal strength. The stronger the signal, the taller the LED bar will be. For example, here is the pattern for the "four out of five" signal strength:

wifi signals -- associated