This project iteration expands on the previous one and adds a dashboard with seven line charts representing the seven data streams the application receives from the two connected Bus Probes (BP Sensors).
Dashboards were first introduced in the Sprinkler Control 5: Web Dashboard project.
Three Line (chart) widgets are added to the dashboard to achieve this. Each widget selects one of the three variables to visualize.
Since some of the data received from BP sensors requires conversion to standard measurement units, a second set of variables was created to hold the final values. For example, there is the output_bp02_temperature variable containing the converted temperature received from the BP#02 sensor. It is this variable that is selected in one of the dashboard widgets.
Here is what the dashboard looks like when the application is running:
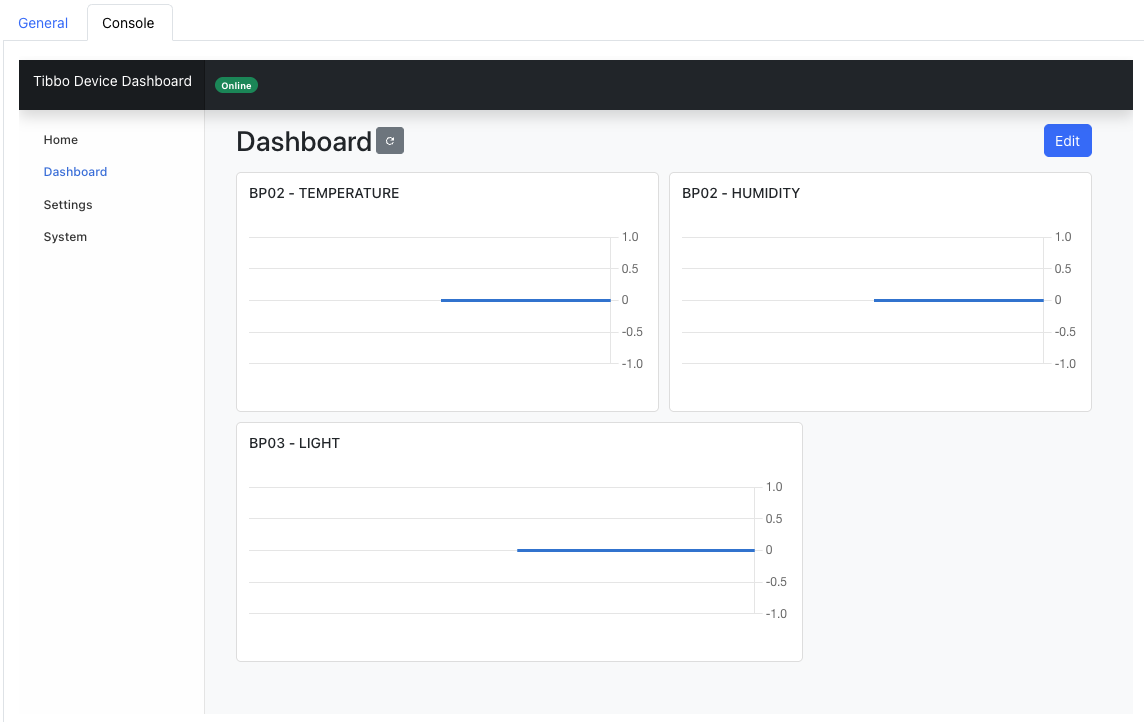
There is no way to influence the environment of Cloud ADK sensors, and their output remains virtually constant.