On the Zephyr runtime, the LCD menu built into TPP2(G2) devices has grown beyond settings: it now lists data tables, shows the network status and can reboot the device. This project is a small cold-chain logger whose main job is to show every part of that menu. It reads the temperature and humidity from a Tibbit 30 every few seconds, logs them to a table, checks them against a table of alert rules, and leaves the rest to the front panel.
The project targets a TPP2(G2) running Zephyr, with the LCD and keypad enabled and a Tibbit 30 in socket 2. Everything the menu shows is described in the LCD Menu documentation; this page walks through it on a real device.
The project
The Settings feature holds eleven settings. They are the ones a logger would need and, together, they cover every control the menu offers:
| Setting | Type | Menu group | Control |
|---|---|---|---|
| DHCP | Number 0..1 | Network | Dropdown (Off, On) |
| IP Address | Text, 15 characters | Network | Text Box |
| Port | Number 1..65535 | Network | Text Box |
| Device Name | Text, 16 characters | Network | Text Box, read only |
| Admin PIN | Text, 8 characters | Network | Password |
| Sampling Interval | Number 1..3600 | Sampling | Text Box |
| Temperature Units | Number 0..1 | Sampling | Dropdown (Celsius, Fahrenheit) |
| Logging | Number 0..1 | Sampling | Dropdown (Off, On) |
| Report Time | Time | Sampling | Text Box |
| Alert Email | Text, 48 characters | Alerts | Text Box |
| Hysteresis | Number 0..5 | Alerts | Text Box |
Two Data Tables complete the picture. SAMPLES is a log of 200 records with a time, a temperature and a humidity; the application appends to it and nobody edits it. RULES is a regular table of 20 records, one per alert rule: a name, a kind (Above or Below), a threshold, an enabled flag and a creation date. At boot, the application seeds it with three rules, Warm, Critical and Frozen, if it is empty.
The flow in the AppBlocks tab is short. A Periodic Timer fires every 5 seconds, takes the temperature and humidity from the Tibbit 30, writes them to the text widgets of the Idle screen and, if Logging is on, inserts a row into SAMPLES. It then walks the RULES table and prints a line to the debug output for every enabled rule whose threshold is crossed. Pressing the MD button or the K1 key runs the Enter LCD Menu block. A change to one of the network settings prints a reminder that a reboot applies it. Finally, a Take Screenshot block wired to a keypad press saved the pictures below to the device's flash.
Configuring the menu
The menu is configured on the LCD page of the Features tab, next to the screens. In the Settings section, each group becomes an entry of the menu, and each setting in a group gets a UI Control Type and an Edit Mode, exactly as on the Web Console. The menu knows the same four control types, Text Box, IP Address, Password and Dropdown, and adapts the text box to the setting: characters for a text, digits for a number, fields for a time. Here DHCP, Units and Logging are dropdowns with two options each, Admin PIN is a password and Device Name is read only; the rest are text boxes.
In the Tables section, we add SAMPLES and RULES and give them the labels Samples and Alert rules. That is all the menu needs to know about a table: it reads the fields and the structure from the table's definition.
On the device
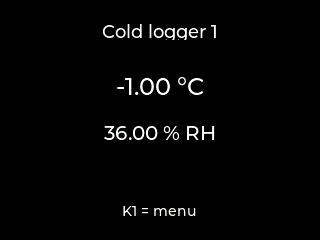
The Idle screen shows the device name, the latest readings and a reminder of the key that opens the menu.
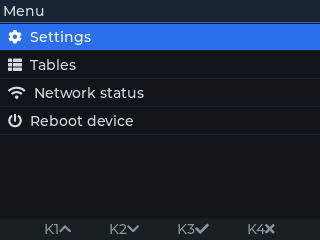
Pressing K1 opens the menu over the screen. Because the project puts tables on the menu, the root is titled Menu and has four entries: Settings, Tables, Network status and Reboot device. The bar at the bottom always tells what the four keys do: K1 up, K2 down, K3 select and K4 back, or exit when at the root.
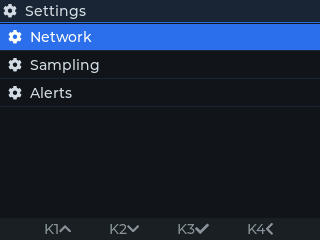
Settings lists our three groups.
In the Network group every row shows its current value on the right. Device Name is read only and drawn dimmer, and Admin PIN is masked.
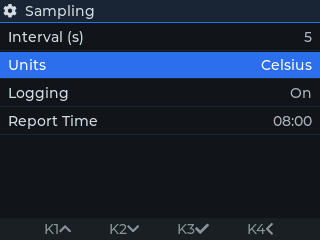
The Sampling group shows how a dropdown and a time look when they are not being edited.
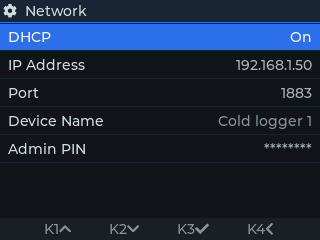
Pressing K3 on a text box opens the editor in a box over the page. A number is edited digit by digit: K1 and K2 step the selected digit, K3 moves to the next one and, after the last digit, stores the value. K4 cancels and the key is drawn in red so there is no doubt about it. A value outside the setting's Minimum and Maximum is refused.
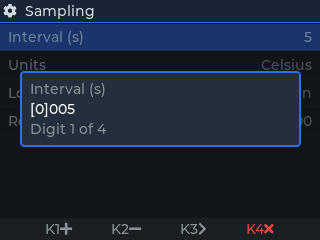
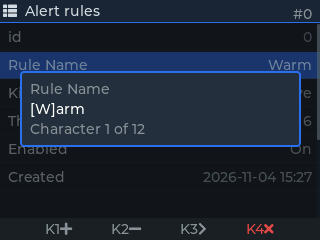
Text is edited the same way, character by character. Our IP address is a plain text box, so it has fifteen of them and the editor says which one is selected. With the IP Address control, the editor would step through the four octets instead, each from 0 to 255.
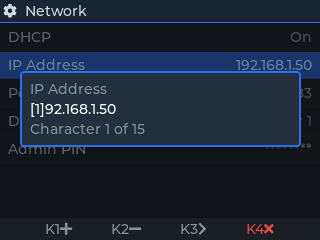
A password only reveals the character being edited; the others stay masked.
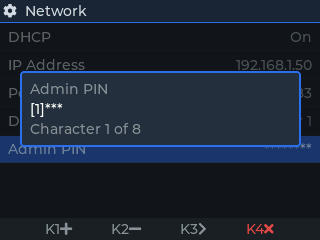
A dropdown opens a page of its options with a check mark on the current one. K3 picks the selected option, K4 leaves it as it was, and the bottom bar colours the two keys green and red to say so.
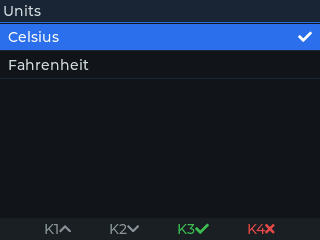
Saved values take effect right away. Settings that a feature only reads at startup, such as the network ones, are applied after the next reboot, which is what the Reboot device entry is for.
Back at the root, Tables lists the two tables under the labels we gave them.
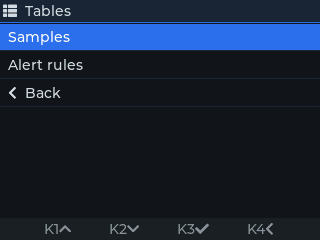
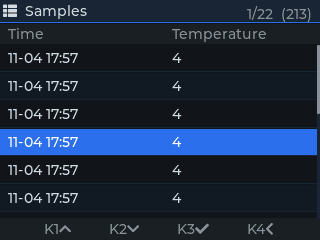
Samples shows the log one page at a time, with the time and the temperature as columns and, in the header, the page we are on, the number of pages and the number of records. A log opens on its newest page. Rows at the end of the list move to the first, previous, next or last page, jump to a page by number, or clear the table.
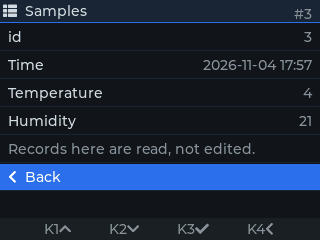
Selecting a record shows all of its fields. Since SAMPLES is a log, the record is read, not edited, and the page says so.
Alert rules is a regular table, so its list starts with New record and ends with Clear table.
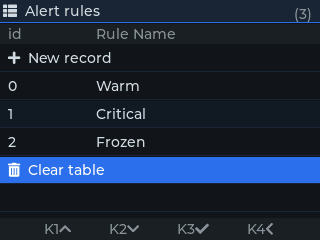
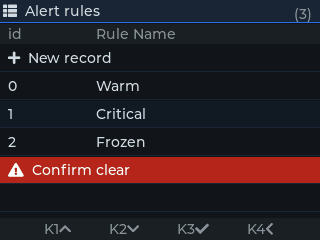
Clearing a table cannot be undone, so the row asks for a second press and turns red while it waits for it.
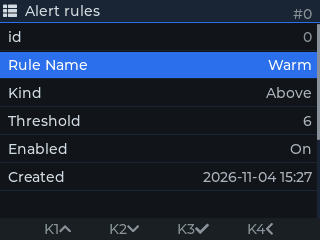
A record of a regular table can be changed. Its page lists every field, then Save record, Delete record and Cancel; nothing is stored until Save record is picked.
Each field opens the same editor as a setting does, a dropdown for the Kind and Enabled fields, a text editor for the name.
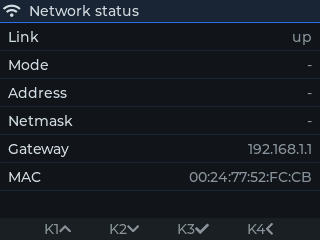
Network status reports the link, the address the device got and its MAC address, which is handy when the device is on a bench with no console attached.
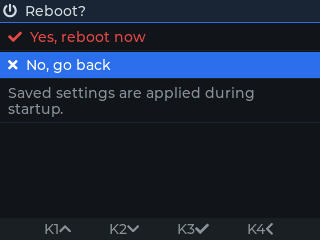
Reboot device asks before doing anything, and reminds that saved settings are applied during startup.
To leave the menu, go back to the root with K4 and press it once more. The Idle screen is still there underneath, with the readings that arrived in the meantime.