Troubleshooting
Troubleshooting is not always necessary, but sometimes, we have to dig in to ensure the quality and reliability of our applications. AppBlocks is exceptional at avoiding common roadblocks often found in traditional development, yet sometimes, we must resort to more in-depth debugging. This guide is a starting point for anyone and everyone who needs a little push towards a production-ready app.
Introduction
AppBlocks excels at preventing mistakes before you even run an application. The user interface across the editor is designed to prevent errors and suggest ideas every step of the way. These hints are incredibly useful, so you might not need to reference this page often.
With the above in mind, we are engineers, and we love our tools, so read on to learn more about troubleshooting in AppBlocks.
In this article, we'll go over the following concepts:
Debugger
Besides visual inspection and analysis of each flow, creators can also use AppBlocks' built-in debugger! We highly recommend using it. The debugger is handy for actually 'seeing' what happens in every step of your program. If you’ve debugged software before, you’ll feel right at home.
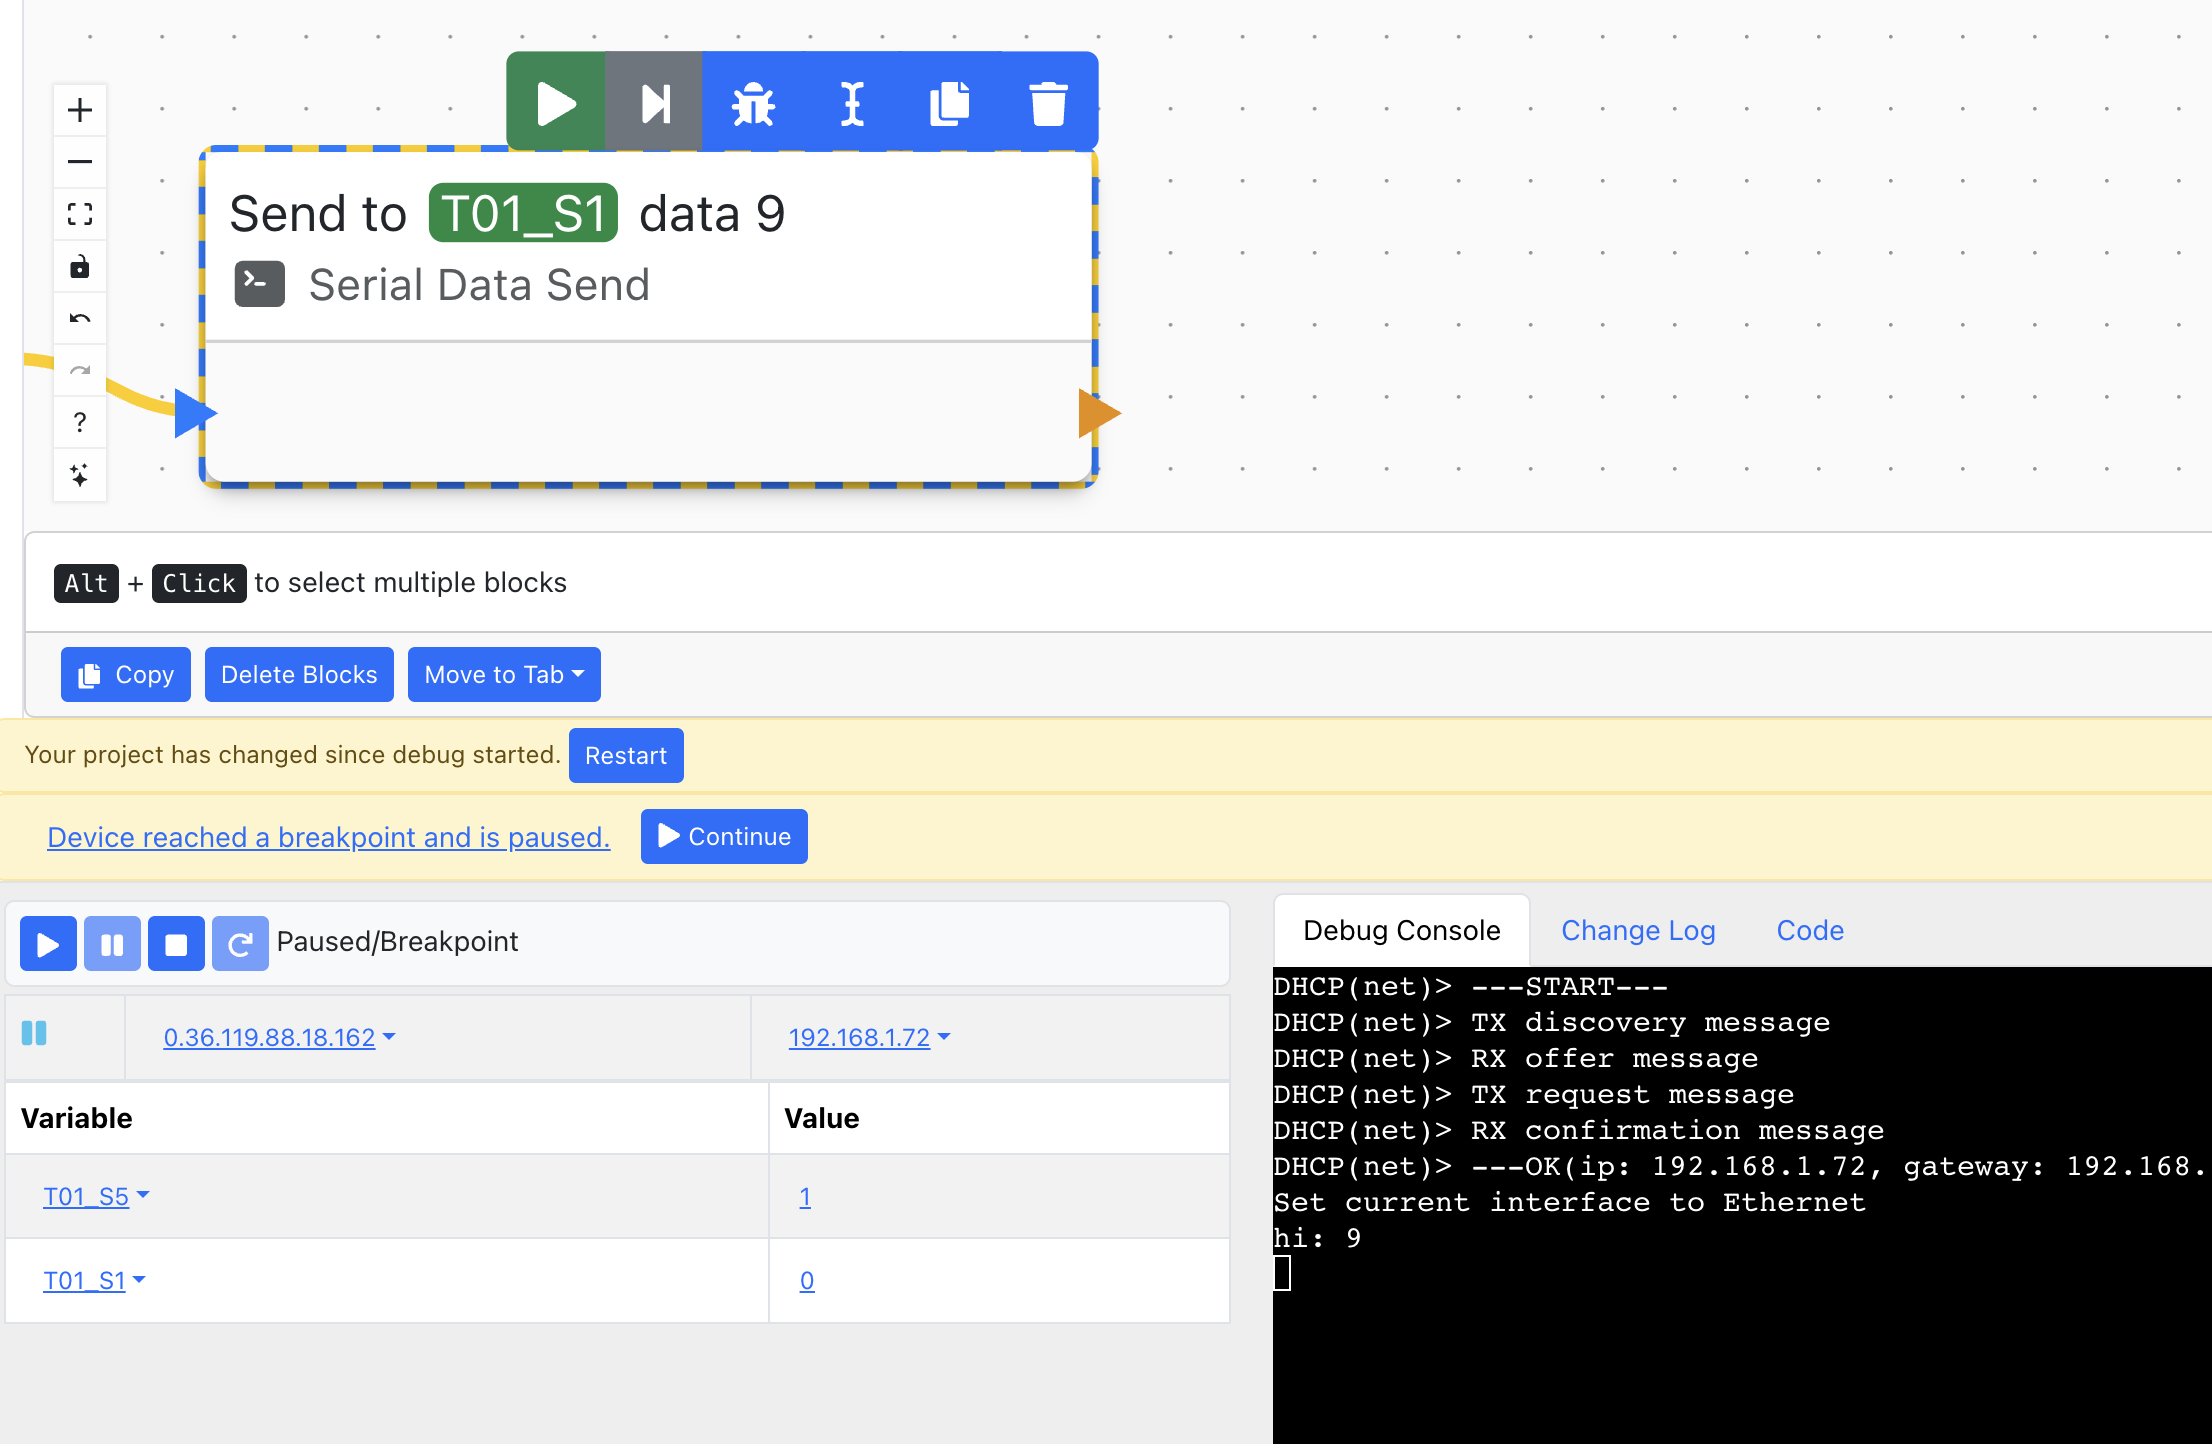
Breakpoints
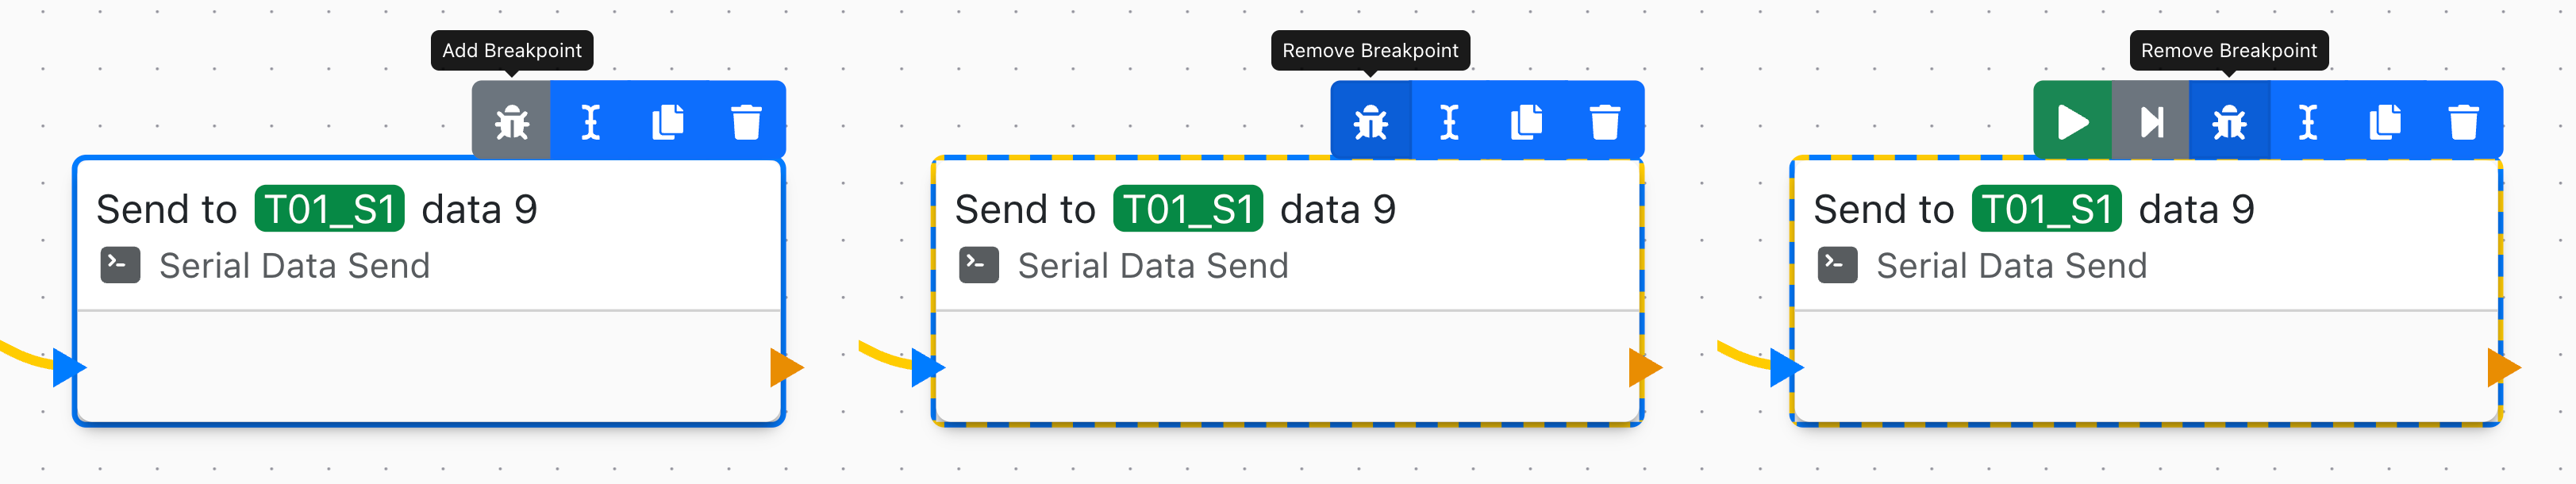
To really make use of the debugger, you have to set a breakpoint on some block in the application. The following image shows a block's states when using breakpoints to debug your program. From left to right:
- No breakpoint set.
- Breakpoint set but not reached yet.
- Program is paused at this breakpoint.
When the application stops due to a breakpoint, you can view the 'current state' of your program's variables in the left panel.
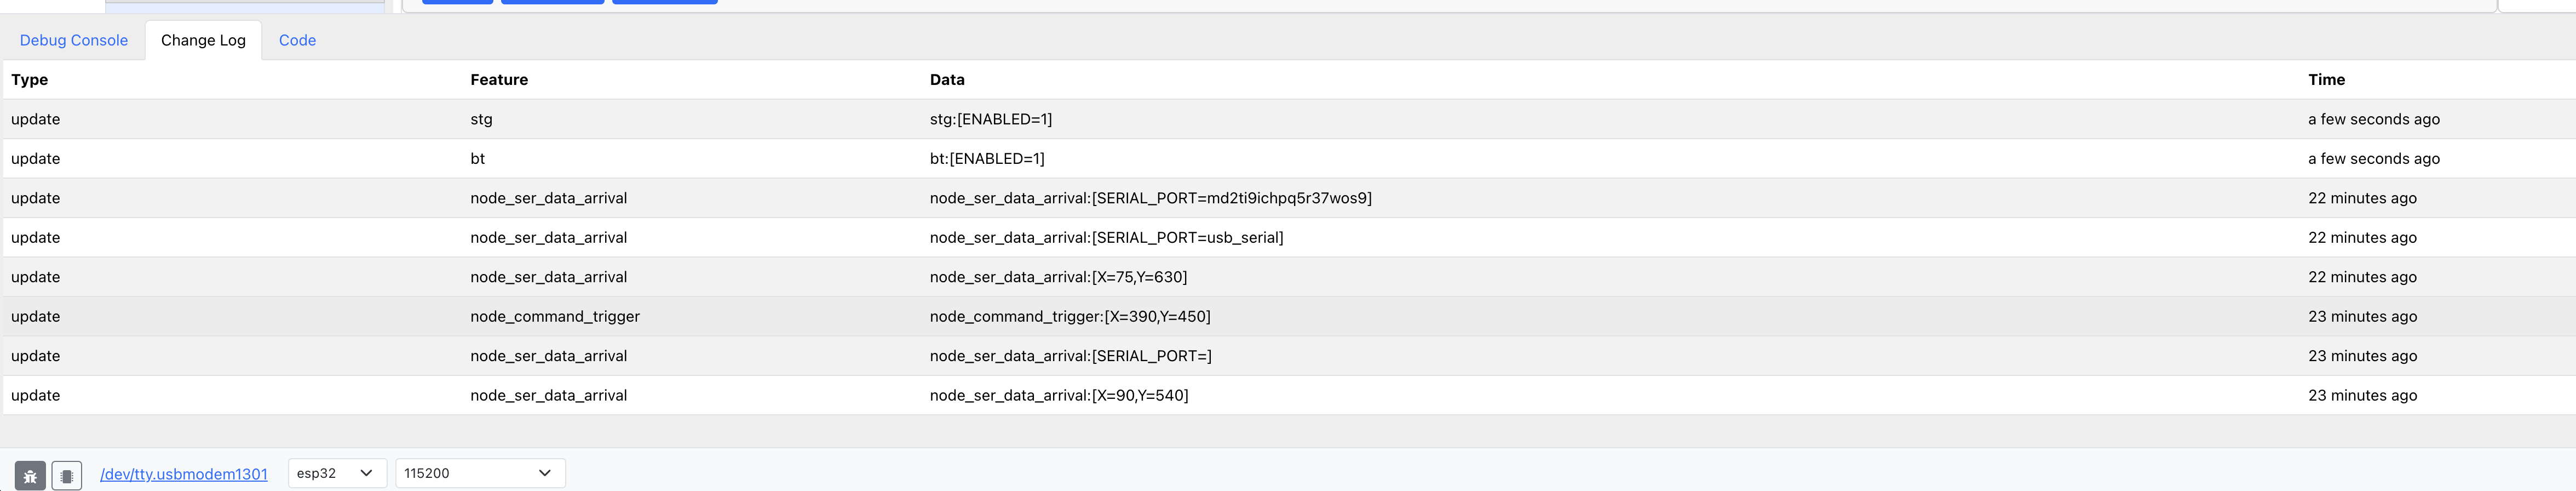
Changelog
Assuming an earlier version of your application was functional, you can check the changelog to single out the problematic modification(s).
Debug Console
The debug console shows debug messages printed by the connected device.
- For Tibbo devices, it works out of the box, and no additional setup is required.
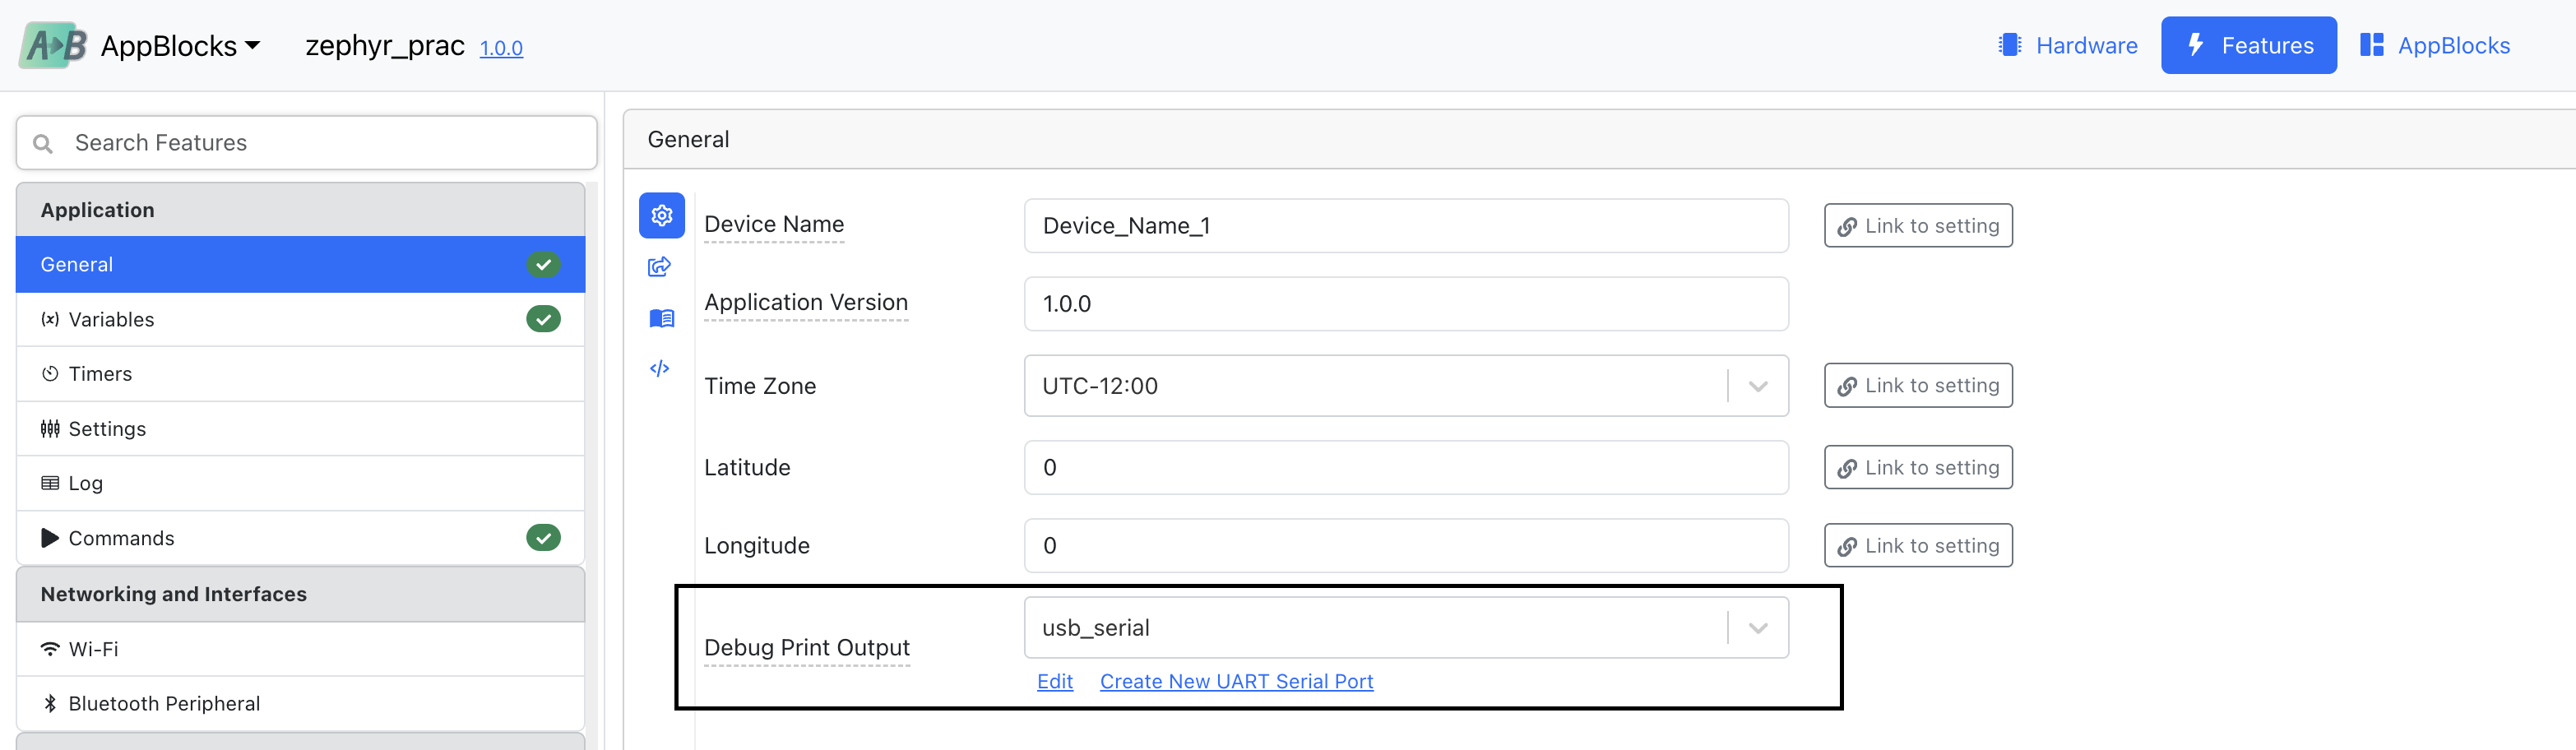
- For other devices, you'll need to manually set the 'Debug Print Output' under the Features > General menu.
Hardware
For hardware in general, check your wiring, sensors, actuators, etc. Make sure that all the sensors are working correctly.
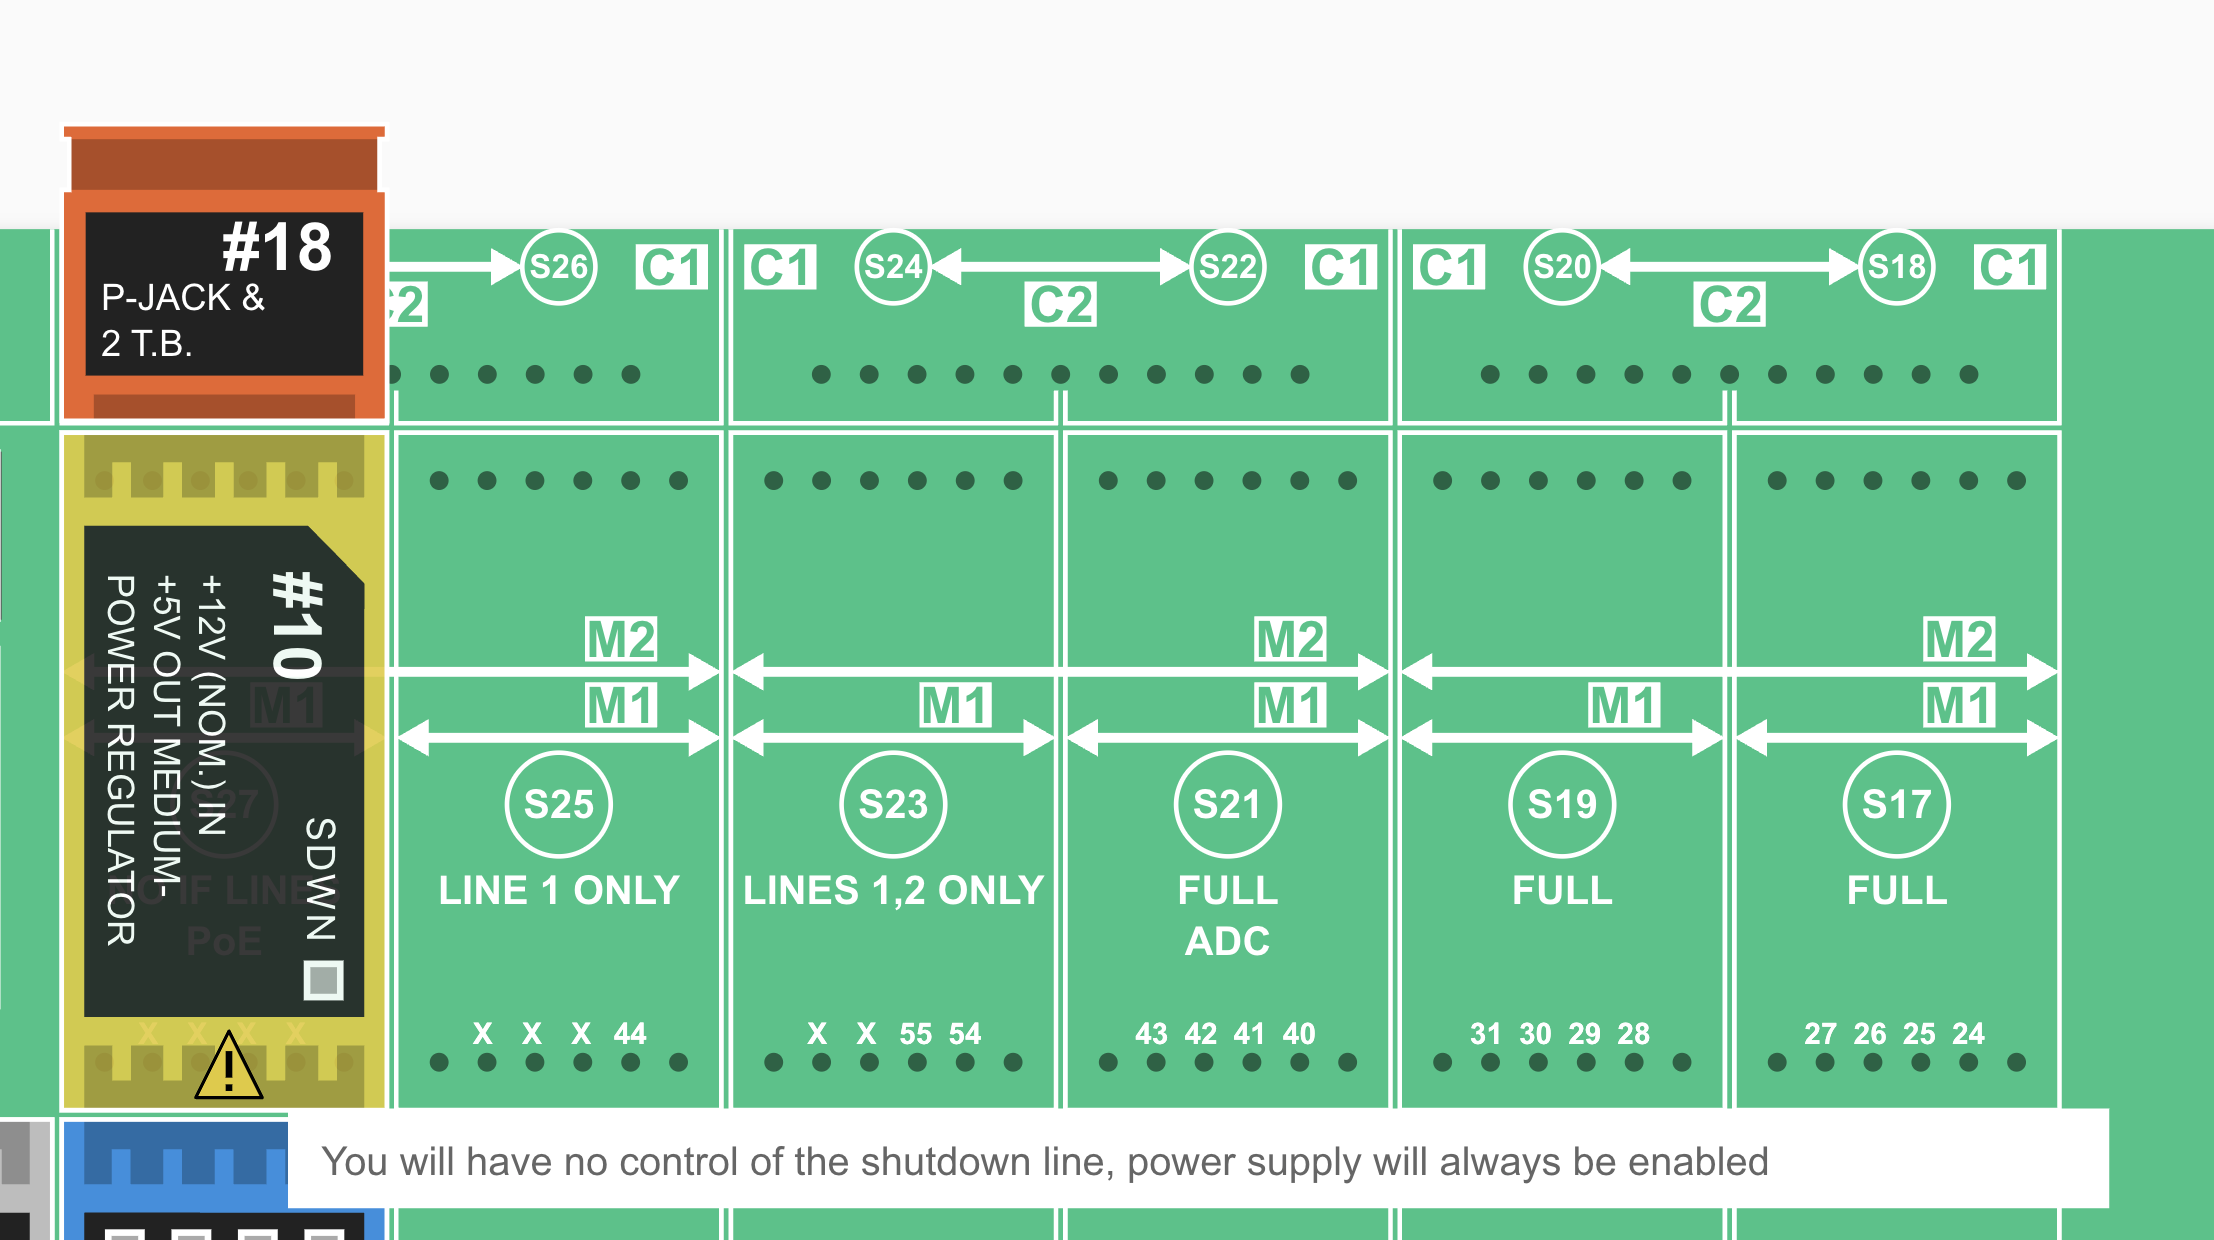
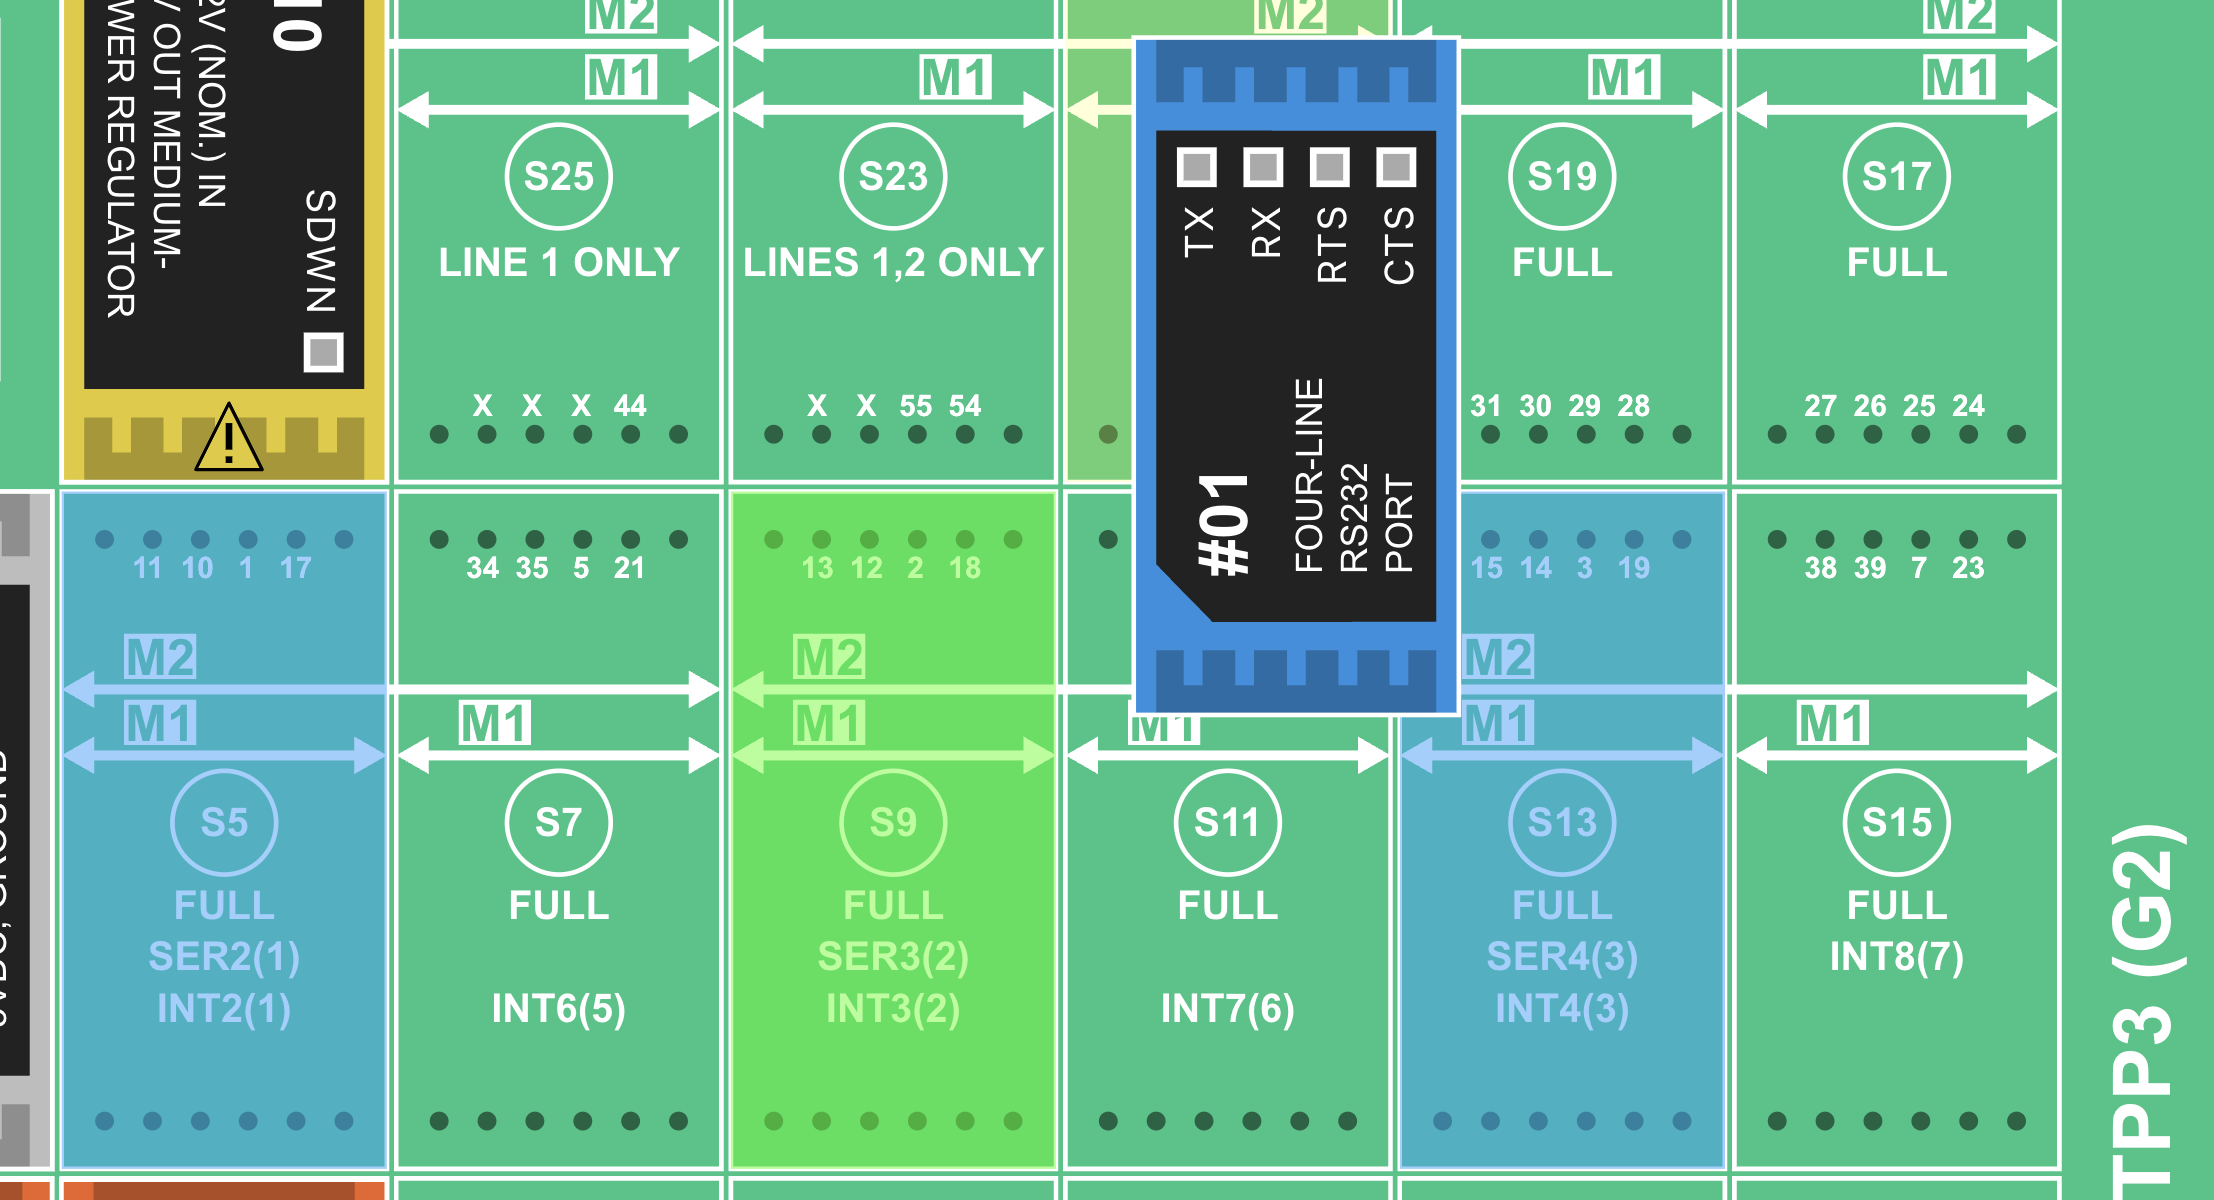
Tibbo Hardware
AppBlocks provides additional support and validation for Tibbo TPS hardware; The hardware view does not allow incorrect placement of Tibbits and warns when a less-than-optimal setup is used.
For example, placing a power Tibbit (e.g., #10, #33) in a socket that doesn't enable its full functionality will display a warning.
You can only place #01 Tibbits on serial-ready sockets.
You also get multiple warnings when using a Tibbit that requires a 15V power supply. In this case, the #13 is used.
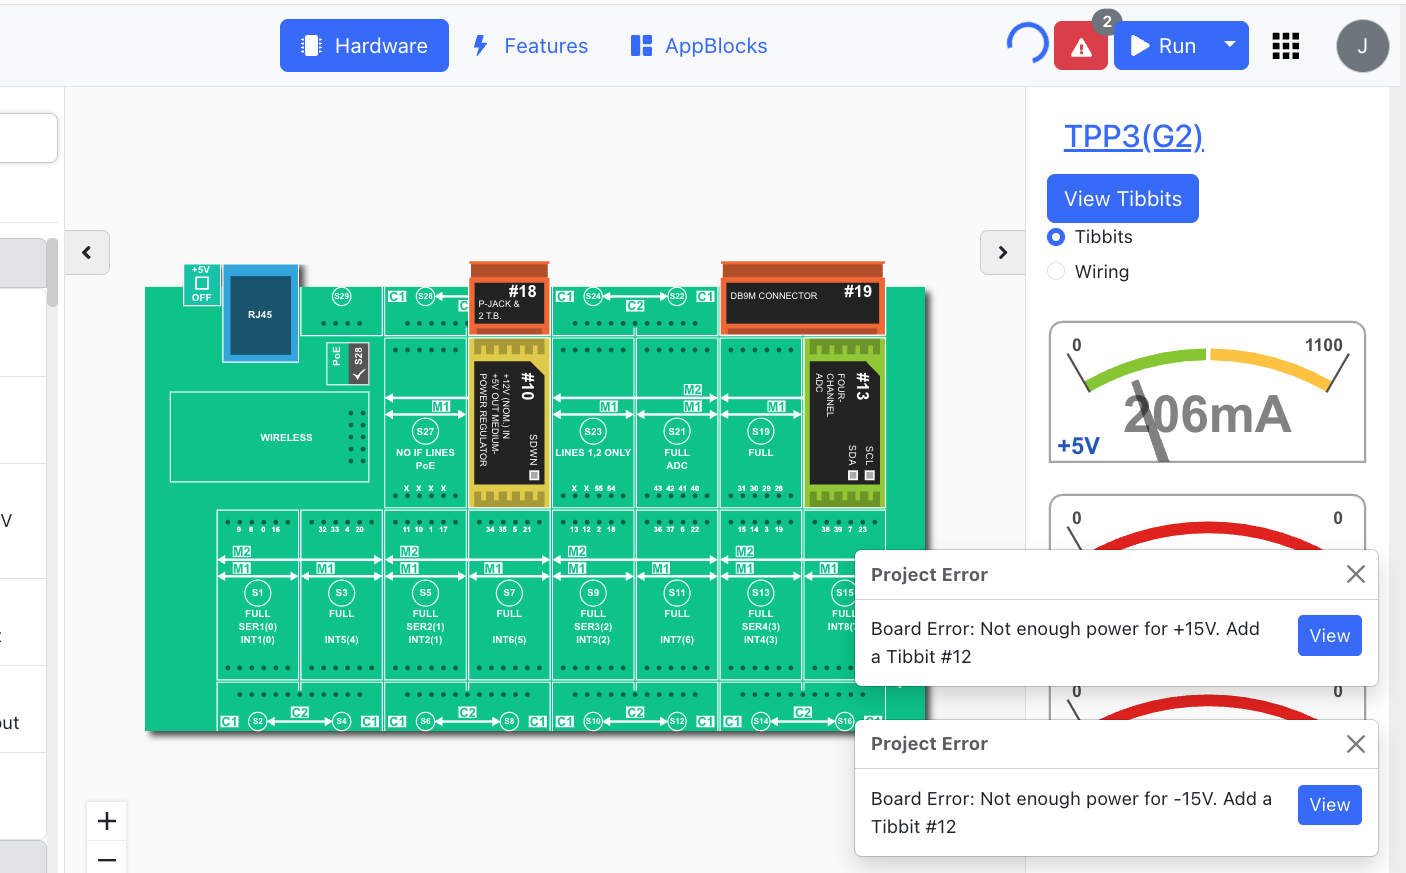
These checks ensure your hardware configuration is safe and functional, before you even run your application.
Advanced
Most users won't need to dive into the generated source code—but it's always there in case you need it.
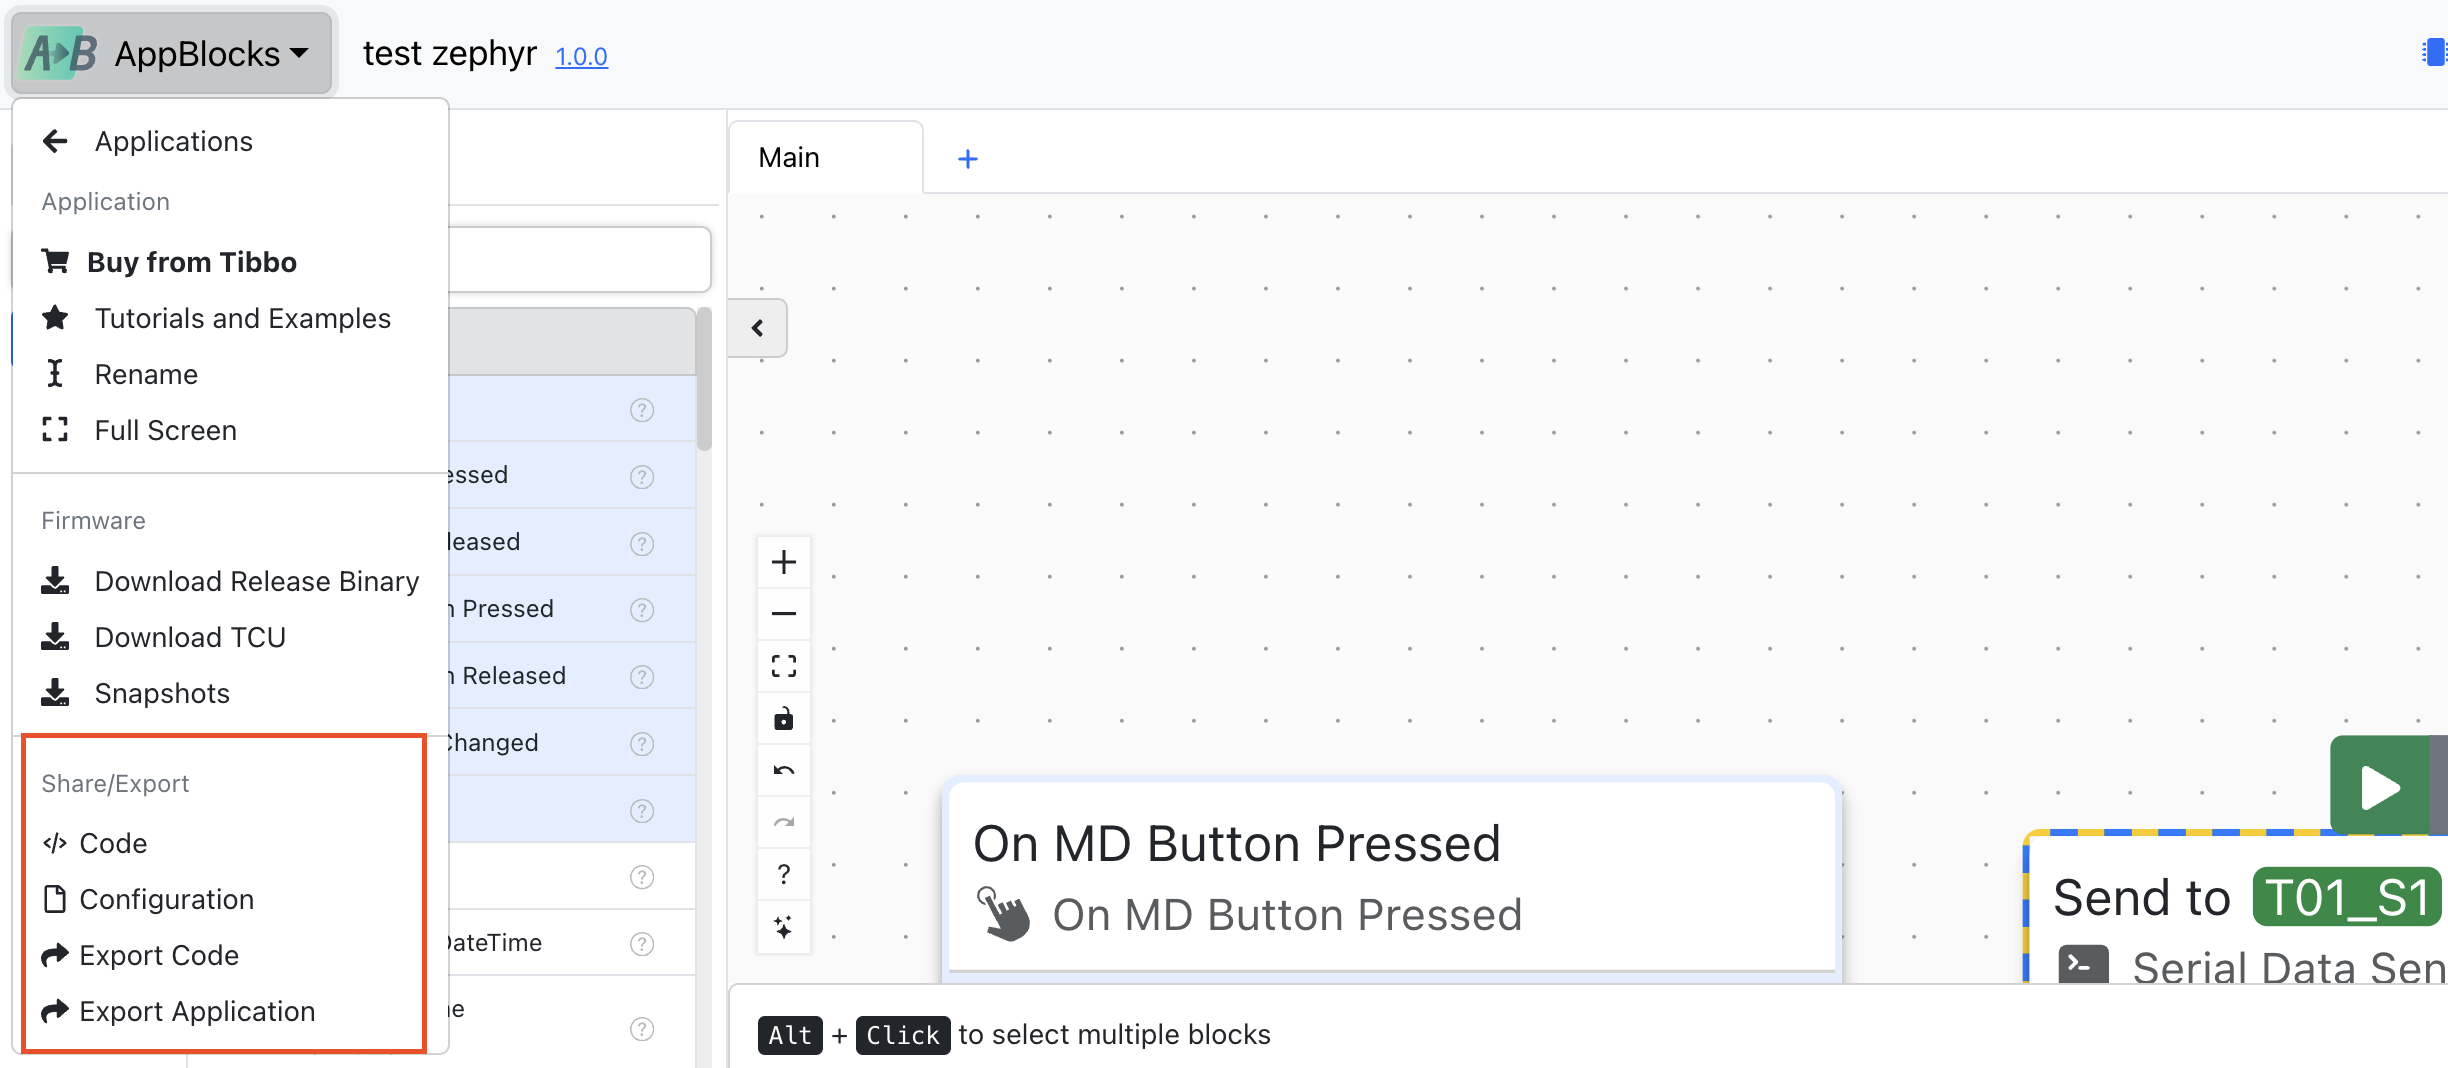
Export Code
More advanced users can also download and read the code by themselves, as another way to 'visualize' the problem at hand.
Code Viewer
Instead of exporting and viewing your code in a full-blown editor, you can also view the generated code from AppBlocks.
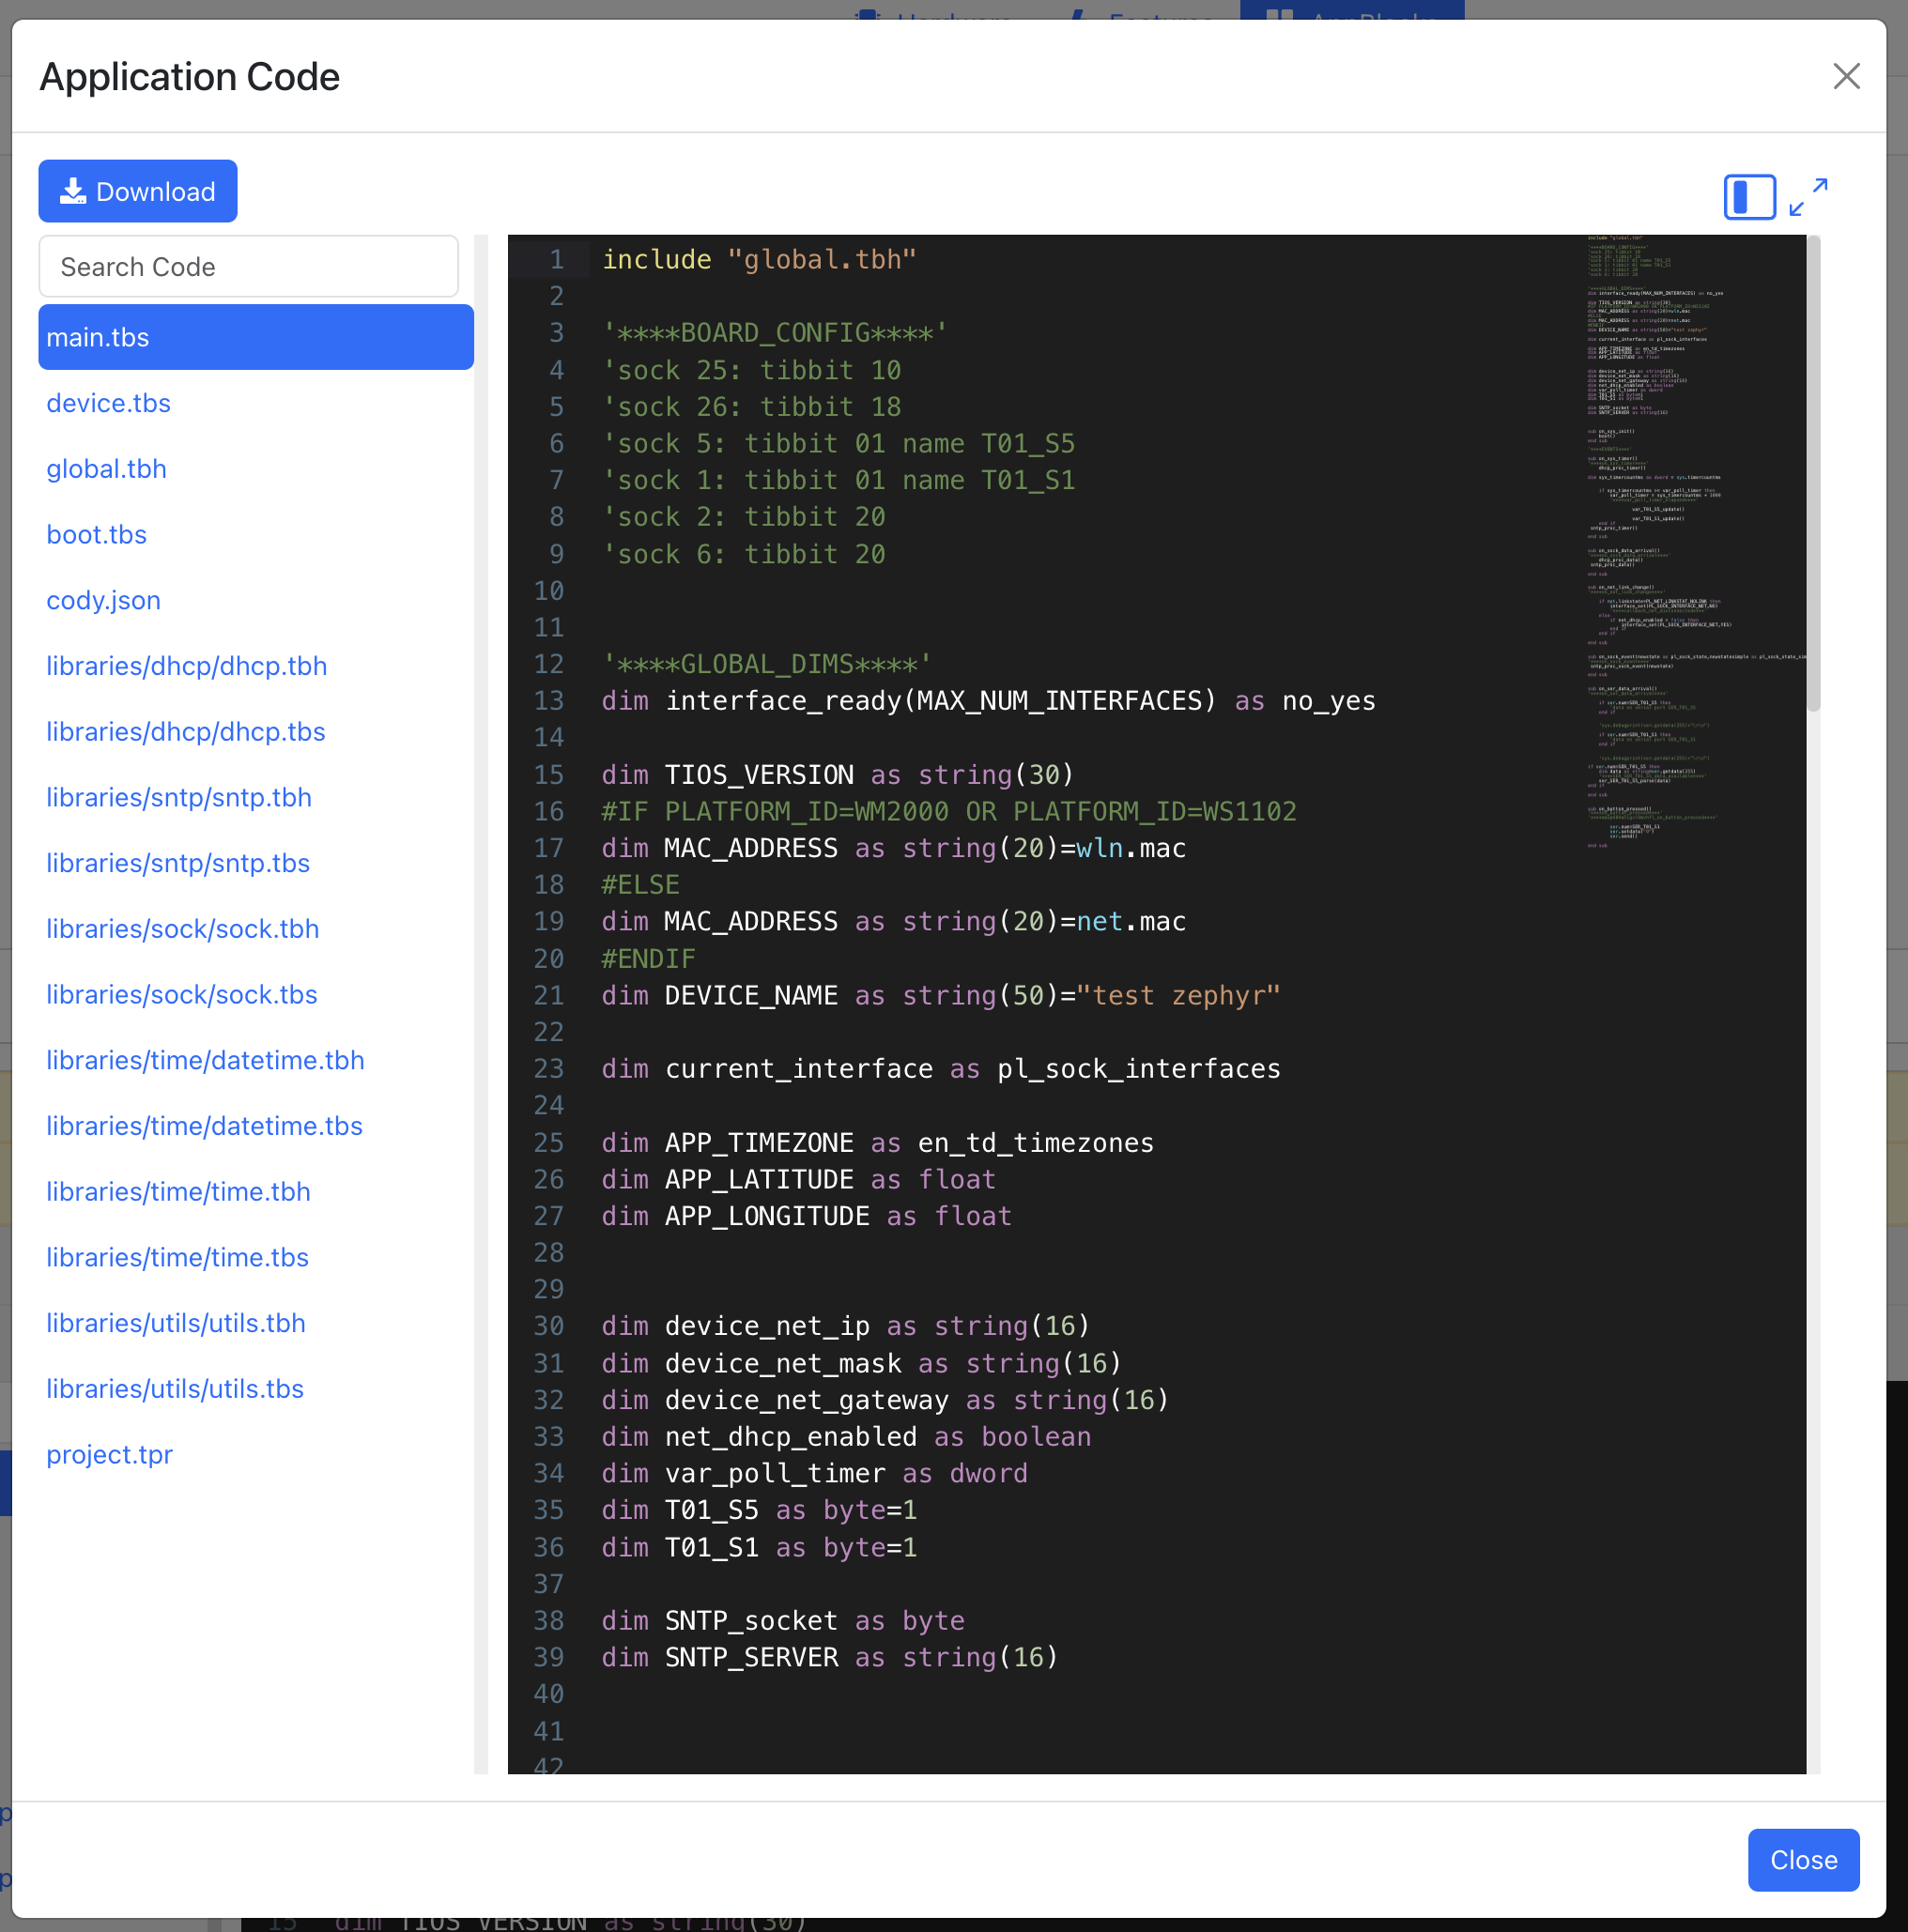
The code can be viewed from either the Share/Export section of the top-right dropdown or the bottom panel of the editor.
Contact Us
Many of these 'friendly reminders' are present throughout AppBlocks; you may run into them at some point. If you are ever unsure about what a warning or error may mean, you can contact us through the following channels:
- Feedback Portal
- Social media: LinkedIn, X (Twitter), Discord